
Java Platform, Standard Edition
Java Virtual Machine Guide
Release 14
F23572-02
May 2021
Java Platform, Standard Edition Java Virtual Machine Guide, Release 14
F23572-02
Copyright © 1993, 2021, Oracle and/or its affiliates.
This software and related documentation are provided under a license agreement containing restrictions on
use and disclosure and are protected by intellectual property laws. Except as expressly permitted in your
license agreement or allowed by law, you may not use, copy, reproduce, translate, broadcast, modify, license,
transmit, distribute, exhibit, perform, publish, or display any part, in any form, or by any means. Reverse
engineering, disassembly, or decompilation of this software, unless required by law for interoperability, is
prohibited.
The information contained herein is subject to change without notice and is not warranted to be error-free. If
you find any errors, please report them to us in writing.
If this is software or related documentation that is delivered to the U.S. Government or anyone licensing it on
behalf of the U.S. Government, then the following notice is applicable:
U.S. GOVERNMENT END USERS: Oracle programs (including any operating system, integrated software,
any programs embedded, installed or activated on delivered hardware, and modifications of such programs)
and Oracle computer documentation or other Oracle data delivered to or accessed by U.S. Government
end users are "commercial computer software" or "commercial computer software documentation" pursuant
to the applicable Federal Acquisition Regulation and agency-specific supplemental regulations. As such,
the use, reproduction, duplication, release, display, disclosure, modification, preparation of derivative works,
and/or adaptation of i) Oracle programs (including any operating system, integrated software, any programs
embedded, installed or activated on delivered hardware, and modifications of such programs), ii) Oracle
computer documentation and/or iii) other Oracle data, is subject to the rights and limitations specified in the
license contained in the applicable contract. The terms governing the U.S. Government’s use of Oracle cloud
services are defined by the applicable contract for such services. No other rights are granted to the U.S.
Government.
This software or hardware is developed for general use in a variety of information management applications.
It is not developed or intended for use in any inherently dangerous applications, including applications that
may create a risk of personal injury. If you use this software or hardware in dangerous applications, then you
shall be responsible to take all appropriate fail-safe, backup, redundancy, and other measures to ensure its
safe use. Oracle Corporation and its affiliates disclaim any liability for any damages caused by use of this
software or hardware in dangerous applications.
Oracle and Java are registered trademarks of Oracle and/or its affiliates. Other names may be trademarks of
their respective owners.
Intel and Intel Inside are trademarks or registered trademarks of Intel Corporation. All SPARC trademarks are
used under license and are trademarks or registered trademarks of SPARC International, Inc. AMD, Epyc,
and the AMD logo are trademarks or registered trademarks of Advanced Micro Devices. UNIX is a registered
trademark of The Open Group.
This software or hardware and documentation may provide access to or information about content, products,
and services from third parties. Oracle Corporation and its affiliates are not responsible for and expressly
disclaim all warranties of any kind with respect to third-party content, products, and services unless otherwise
set forth in an applicable agreement between you and Oracle. Oracle Corporation and its affiliates will not
be responsible for any loss, costs, or damages incurred due to your access to or use of third-party content,
products, or services, except as set forth in an applicable agreement between you and Oracle.

Contents
Preface
Audience vi
Documentation Accessibility vi
Related Documents vi
Conventions vi
1
Java Virtual Machine Technology Overview
2
Compiler Control
Writing Directives 2-1
Compiler Control Options 2-2
Writing a Directive File 2-5
Writing a Compiler Directive 2-7
Writing a Method Pattern in a Compiler Directive 2-9
Writing an Inline Directive Option 2-10
Preventing Duplication with the Enable Option 2-10
Understanding Directives 2-11
What Is the Default Directive? 2-12
How Directives are Applied to Code? 2-14
Compiler Control and Backward Compatibility 2-15
Commands for Working with Directive Files 2-16
Compiler Directives and the Command Line 2-16
Compiler Directives and Diagnostic Commands 2-17
Getting Your Java Process Identification Number 2-17
Adding Directives Through Diagnostic Commands 2-17
Removing Directives Through Diagnostic Commands 2-18
Printing Directives Through Diagnostic Commands 2-18
How Directives Are Ordered in the Directives Stack? 2-18
iii

3
Garbage Collection
4
Class Data Sharing
Class Data Sharing 4-1
Application Class-Data Sharing 4-2
Dynamic CDS Archive 4-2
Regenerating the Shared Archive 4-2
Manually Controlling Class Data Sharing 4-3
5
Java HotSpot Virtual Machine Performance Enhancements
Compact Strings 5-1
Tiered Compilation 5-2
Segmented Code Cache 5-2
Graal : a Java-Based JIT Compiler 5-3
Ahead-of-Time Compilation 5-3
Compressed Ordinary Object Pointer 5-4
Zero-Based Compressed Ordinary Object Pointers 5-5
Escape Analysis 5-5
6
JVM Constants API
7
Support for Non-Java Languages
Introduction to Non-Java Language Features 7-1
Static and Dynamic Typing 7-2
Statically-Typed Languages Are Not Necessarily Strongly-Typed Languages 7-3
The Challenge of Compiling Dynamically-Typed Languages 7-3
The invokedynamic Instruction 7-5
Defining the Bootstrap Method 7-6
Specifying Constant Pool Entries 7-7
Example Constant Pool 7-7
Using the invokedynamic Instruction 7-8
8
Signal Chaining
iv

9
Native Memory Tracking
Key Features 9-1
Using Native Memory Tracking 9-1
Enabling NMT 9-1
Accessing NMT Data using jcmd 9-2
Obtaining NMT Data at VM Exit 9-2
10
DTrace Probes in HotSpot VM
Using the hotspot Provider 10-1
VM Lifecycle Probes 10-1
Thread Lifecycle Probes 10-2
Classloading Probes 10-2
Garbage Collection Probes 10-3
Method Compilation Probes 10-4
Monitor Probes 10-5
Application Tracking Probes 10-6
Using the hotspot_jni Provider 10-7
Sample DTrace Probes 10-7
11
Fatal Error Reporting
Error Report Example 11-1
12
Java Virtual Machine Related Resources
Tools 12-1
v

Preface
This document provides information about the features supported by Java Virtual
Machine technology.
Audience
This document is intended for experienced developers who build applications using
the Java HotSpot technology.
Documentation Accessibility
For information about Oracle's commitment to accessibility, visit the
Oracle Accessibility Program website at http://www.oracle.com/pls/topic/lookup?
ctx=acc&id=docacc.
Access to Oracle Support
Oracle customers that have purchased support have access to electronic support
through My Oracle Support. For information, visit http://www.oracle.com/pls/topic/
lookup?ctx=acc&id=info or visit http://www.oracle.com/pls/topic/lookup?ctx=acc&id=trs
if you are hearing impaired.
Related Documents
See JDK 14 Documentation for other JDK 15 guides.
Conventions
The following text conventions are used in this document:
Convention Meaning
boldface
Boldface type indicates graphical user interface elements associated
with an action, or terms defined in text.
italic Italic type indicates book titles, emphasis, or placeholder variables for
which you supply particular values.
monospace
Monospace type indicates commands within a paragraph, URLs, code
in examples, text that appears on the screen, or text that you enter.
Preface
vi

1
Java Virtual Machine Technology Overview
This chapter describes the implementation of the Java Virtual Machine (JVM) and the
main features of the Java HotSpot technology:
• Adaptive compiler: A standard interpreter is used to launch the applications.
When the application runs, the code is analyzed to detect performance
bottlenecks, or hot spots. The Java HotSpot VM compiles the performance-critical
portions of the code for a boost in performance, but does not compile the seldom-
used code (most of the application). The Java HotSpot VM uses the adaptive
compiler to decide how to optimize compiled code with techniques such as
inlining.
• Rapid memory allocation and garbage collection: Java HotSpot technology
provides rapid memory allocation for objects and fast, efficient, state-of-the-art
garbage collectors.
• Thread synchronization: Java HotSpot technology provides a thread-handling
capability that is designed to scale for use in large, shared-memory multiprocessor
servers.
In Oracle Java Runtime Environment (JRE) 8 and earlier, different implementations
of the JVM, (the client VM, server VM, and minimal VM) were supported for
configurations commonly used as clients, as servers, and for embedded systems.
Because most systems can now take advantage of the server VM, only that VM
implementation is provided in later versions.
1-1

2
Compiler Control
Compiler Control provides a way to control Java Virtual Machine (JVM) compilation
through compiler directive options. The level of control is runtime-manageable and
method specific.
A compiler directive is an instruction that tells the JVM how compilation should occur.
A directive provides method-context precision in controlling the compilation process.
You can use directives to write small, contained, JVM compiler tests that can run
without restarting the entire JVM. You can also use directives to create workarounds
for bugs, in the JVM compilers.
You can specify a file that contains compiler directives when you start a program
through the command line. You can also add or remove directives from an already
running program by using diagnostic commands.
Compiler Control supersedes and is backward compatible with CompileCommand.
Topics:
• Writing Directives
– Writing a Directive File
– Writing a Compiler Directive
– Writing a Method Pattern in a Compiler Directive
– Writing an Inline Directive Option
– Preventing Duplication with the Enable Option
• Understanding Directives
– What Is the Default Directive?
– How Directives are Applied to Code?
– Compiler Control and Backward Compatibility
• Commands for Working with Directive Files
– Compiler Directives and the Command Line
– Compiler Directives and Diagnostic Commands
– How Directives Are Ordered in the Directives Stack?
Writing Directives
This topic examines Compiler Control options and steps for writing directives from
those options.
Topics:
• Compiler Control Options
2-1

• Writing a Directive File
• Writing a Compiler Directive
• Writing a Method Pattern in a Compiler Directive
• Writing an Inline Directive Option
• Preventing Duplication with the Enable Option
Compiler Control Options
Options are instructions for compilation. Options provide method-context precision.
Available options vary by compiler and require specific types of values.
Table 2-1 Common Options
Option Description Value Type Default Value
Enable
Hides a directive and
renders it unmatchable
if it is set to
false
. This option is
useful for preventing
option duplication. See
Preventing Duplication
with the Enable
Option.
bool true
Exclude
Excludes methods
from compilation.
bool false
BreakAtExecute
Sets a breakpoint
to stop execution
at the beginning of
the specified methods
when debugging the
JVM.
bool false
BreakAtCompile
Sets a breakpoint
to stop compilation
at the beginning of
the specified methods
when debugging the
JVM.
bool false
Log
Places only the
specified methods in a
log. You must first set
the command-line
option
-
XX:+LogCompilatio
n
. The default value
false
places all
compiled methods in a
log.
bool false
PrintAssembly
Prints assembly code
for bytecoded and
native methods by
using the external
disassembler.so
library.
bool false
Chapter 2
Writing Directives
2-2

Table 2-1 (Cont.) Common Options
Option Description Value Type Default Value
PrintInlining
Prints which methods
are inlined, and where.
bool false
PrintNMethods
Prints nmethods as
they are generated.
bool false
BackgroundCompila
tion
Compiles methods
as a background
task. Methods run
in interpreter mode
until the background
compilation finishes.
The value
false
compiles methods as
a foreground task.
bool true
ReplayInline
Enables the same
CIReplay
functionality
as the corresponding
global option, but on a
per-method basis.
bool false
DumpReplay
Enables the same
CIReplay
functionality
as the corresponding
global option, but on a
per-method basis.
bool false
DumpInline
Enables the same
CIReplay
functionality
as the corresponding
global option, but on a
per-method basis.
bool false
CompilerDirective
sIgnoreCompileCom
mands
Disregards all
CompileCommands.
bool false
DisableIntrinsic
Disables the use
of intrinsics based
on method-matching
criteria.
ccstr
No default value.
inline
Forces or prevents
inlining of a method
based on method-
matching criteria. See
Writing an Inline
Directive Option.
ccstr[]
No default value.
Table 2-2 C2 Exclusive Options
Option Description Value Type Default Value
BlockLayoutByFreq
uency
Moves infrequent
execution branches
from the hot path.
bool true
Chapter 2
Writing Directives
2-3

Table 2-2 (Cont.) C2 Exclusive Options
Option Description Value Type Default Value
PrintOptoAssembly
Prints generated
assembly code
after compilation by
using the external
disassembler.so
library. This requires a
debugging build of the
JVM.
bool false
PrintIntrinsics
Prints which intrinsic
methods are used,
and where.
bool false
TraceOptoPipelini
ng
Traces pipelining
information, similar
to the corresponding
global option, but
on a per-method
basis. This is intended
for slow and fast
debugging builds.
bool false
TraceOptoOutput
Traces pipelining
information, similar
to the corresponding
global option, but
on a per-method
basis. This is intended
for slow and fast
debugging builds.
bool false
TraceSpilling
Traces variable
spilling.
bool false
Vectorize
Performs calculations
in parallel, across
vector registers.
bool false
VectorizeDebug
Performs calculations
in parallel, across
vector registers. This
requires a debugging
build of the JVM.
intx 0
CloneMapDebug
Enables you
to examine the
CloneMap
generated
from vectorization.
This requires a
debugging build of the
JVM.
bool false
Chapter 2
Writing Directives
2-4

Table 2-2 (Cont.) C2 Exclusive Options
Option Description Value Type Default Value
IGVPrintLevel
Specifies the points
where the compiler
graph is printed in
Oracle’s Hotspot Ideal
Graphic Visualizer
(IGV). A higher
value means higher
granularity.
intx 0
MaxNodeLimit
Sets the maximum
number of nodes to
use during a single
method’s compilation.
intx 80000
A
ccstr
value type is a method pattern. See Writing a Method Pattern in a Compiler
Directive.
The default directive supplies default values for compiler options. See What Is the
Default Directive?
Writing a Directive File
Individual compiler directives are written in a directives file. Only directive files, not
individual directives, can be added to the stack of active directives.
1. Create a file with a
.json
extension. Directive files are written using a subset of
JSON syntax with minor additions and deviations.
2. Add the following syntax as a template you can work from:
[ //Array of Directives
{ //Directive Block
//Directive 1
},
{ //Directive Block
//Directive 2
},
]
The components of this template are:
Array of Directives
• A directives file stores an array of directive blocks, denoted with a pair of
brackets (
[]
).
• The brackets are optional if the file contains only a single directive block.
Directive Block
• A block is denoted with a pair of braces (
{}
).
• A block contains one individual directive.
• A directives file can contain any number of directive blocks.
Chapter 2
Writing Directives
2-5

• Blocks are separated with a comma (
,
).
• A comma is optional following the final block in the array.
Directive
• Each directive must be within a directive block.
• A directives file can contain multiple directives when it contains multiple
directive blocks.
Comments
• Single-line comments are preceded with two slashes (
//
).
• Multiline comments are not allowed.
3. Add or remove directive blocks from the template to match the number of
directives you want in the directives file.
4. In each directive block, write one compiler directive. See Writing a Compiler
Directive.
5. Reorder the directive blocks if necessary. The ordering of directives in a file is
significant. Directives written closer to the beginning of the array receive higher
priority. For more information, see How Directives Are Ordered in the Directives
Stack? and How Directives are Applied to Code?
[ //Array of directives
{ //Directive Block
//Directive 1
match: ["java*.*", "oracle*.*"],
c1: {
Enable: true,
Exclude: true,
BreakAtExecute: true,
},
c2: {
Enable: false,
MaxNodeLimit: 1000,
},
BreakAtCompile: true,
DumpReplay: true,
},
{ //Directive Block
//Directive 2
match: ["*Concurrent.*"],
c2: {
Exclude:true,
},
},
]
Chapter 2
Writing Directives
2-6

Writing a Compiler Directive
You must write a compiler directive within a directives file. You can repeat the following
steps for each individual compiler directive that you want to write in a directives file.
An individual compiler directive is written within a directive block in a directives file.
See Writing a Directive File.
1. Insert the following block of code, as a template you can work from, to write an
individual compiler directive. This block of code is a directive block.
{
match: [],
c1: {
//c1 directive options
},
c2: {
//c2 directive options
},
//Directive options applicable to all compilers
},
2. Provide the
match
attribute with an array of method patterns. See Writing a Method
Pattern in a Compiler Directive.
For example:
match: ["java*.*", "oracle*.*"],
3. Provide the
c1
attribute with a block of comma-separated directive options. Ensure
that these options are valid for the c1 compiler.
For example:
c1: {
Enable: true,
Exclude: true,
BreakAtExecute: true,
},
4. Provide the
c2
attribute with a block of comma-separated directive options. This
block can contain a mix of common and c2-exclusive compiler options.
For example:
c2: {
Enable: false,
MaxNodeLimit: 1000,
},
5. Provide, at the end of the directive, options you want applicable to all compilers.
These options are considered written within the scope of the common block.
Options are comma-separated.
Chapter 2
Writing Directives
2-7

For example:
BreakAtCompile: true,
DumpReplay: true,
6. Clean up the file by completing the following steps.
a. Check for the duplication of directive options. If a conflict occurs, then the last
occurrence of an option takes priority. Conflicts typically occur between the
common block and the c1 or c2 blocks, not between the c1 and c2 blocks.
b. Avoid writing c2-exclusive directive options in the common block. Although
the common block can accept a mix of common and c2-exclusive options, it’s
pointless to structure a directive this way because c2-exclusive options in the
common block have no effect on the c1 compiler. Write c2-exclusive options
within the c2 block instead.
c. If the
c1
or
c2
attribute has no corresponding directive options, then omit the
attribute-value syntax for that compiler.
The following example shows the resulting directive, based on earlier examples, is:
{
match: ["java*.*", "oracle*.*"],
c1: {
Enable: true,
Exclude: true,
BreakAtExecute: true,
},
c2: {
Enable: false,
MaxNodeLimit: 1000,
},
BreakAtCompile: true,
DumpReplay: true,
},
The JSON format of directive files allows the following deviations in syntax:
• Extra trailing commas are optional in arrays and objects.
• Attributes are strings and are optionally placed within quotation marks.
• If an array contains only one element, then brackets are optional.
Therefore, the following example shows a valid compiler directive:
{
"match": "*Concurrent.*",
c2: {
"Exclude": true,
}
},
Chapter 2
Writing Directives
2-8

Writing a Method Pattern in a Compiler Directive
A
ccstr
is a method pattern that you can write precisely or you can generalize with
wildcard characters. You can specify what best-matching Java code should have
accompanying directive options applied, or what Java code should be inlined.
To write a method pattern:
1. Use the following syntax to write your method pattern:
package/
class.method(parameter_list)
. To generalize a method pattern with wildcard
characters, see Step 2.
The following example shows a method pattern that uses this syntax:
java/lang/String.indexOf()
Other formatting styles are available. This ensures backward compatibility with
earlier ways of method matching such as CompileCommand. Valid formatting
alternatives for the previous example include:
•
java/lang/String.indexOf()
•
java/lang/String,indexOf()
•
java/lang/String indexOf()
•
java.lang.String::indexOf()
The last formatting style matches the HotSpot output.
2. Insert a wildcard character (
*
) where you want to generalize part of the method
pattern.
The following examples are valid generalizations of the method pattern example in
Step 1:
•
java/lang/String.indexOf*
•
*lang/String.indexOf*
•
*va/lang*.*dex*
•
java/lang/String.*
•
*.*
Increased generalization leads to decreased precision. More Java code becomes
a potential match with the method pattern. Therefore, it’s important to use the
wildcard character (
*
) judiciously.
3. Modify the signature portion of the method pattern, according to the Java
Specifications. A signature match must be exact, otherwise the signature defaults
to a wildcard character (
*
). Omitted signatures also default to a wildcard character.
Signatures cannot contain the wildcard character.
4. Optional: If you write a method pattern to accompany the
inline
directive option,
then you must prefix the method pattern with additional characters. See Writing an
Inline Directive Option.
Chapter 2
Writing Directives
2-9

Writing an Inline Directive Option
The attribute for an
inline
directive option requires an array of method patterns with
special commands prefixed. This indicates which method patterns should or shouldn’t
inline.
1. Write
inline:
in the common block, c1 block , or c2 block of a directive.
2. Add an array of carefully ordered method patterns. The prefixed command on the
first matching method pattern is executed. The remaining method patterns in the
array are ignored.
3. Prefix a
+
to force inlining of any matching Java code.
4. Prefix a
-
to prevent inlining of any matching Java code.
5. Optional: If you need inlining behavior applied to multiple method patterns, then
repeat Steps 1 to 4 to write multiple
inline
statements. Don’t write a single array
that contains multiple method patterns.
The following examples show the
inline
directive options:
•
inline: ["+java/lang*.*", "-sun*.*"]
•
inline: "+java/lang*.*"
Preventing Duplication with the Enable Option
You can use the
Enable
option to hide aspects of directives and prevent duplication
between directives.
In the following example, the
c1
attribute of the compiler directives are identical.:
[
{
match: ["java*.*"],
c1: {
BreakAtExecute: true,
BreakAtCompile: true,
DumpReplay: true,
DumpInline: true,
},
c2: {
MaxNodeLimit: 1000,
},
},
{
match: ["oracle*.*"],
c1: {
BreakAtExecute: true,
BreakAtCompile: true,
DumpReplay: true,
DumpInline: true,
},
c2: {
MaxNodeLimit: 2000,
},
Chapter 2
Writing Directives
2-10

},
]
The following example shows how the undesirable code duplication is resolved with
the
Enable
option.
Enable
hides the block directives and renders them unmatchable.
[
{
match: ["java*.*"],
c1: {
Enable: false,
},
c2: {
MaxNodeLimit: 1000,
},
},
{
match: ["oracle*.*"],
c1: {
Enable: false,
},
c2: {
MaxNodeLimit: 2000,
},
},
{
match: ["java*.*", "oracle*.*"],
c1: {
BreakAtExecute: true,
BreakAtCompile: true,
DumpReplay: true,
DumpInline: true,
},
c2: {
//Unreachable code
},
},
]
Typically, the first matching directive is applied to a method’s compilation. The
Enable
option provides an exception to this rule. A method that would typically be compiled
by
c1
in the first or second directive is now compiled with the
c1
block of the third
directive. The
c2
block of the third directive is unreachable because the
c2
blocks in
the first and second directive take priority.
Understanding Directives
The following topics examine how directives behave and interact.
Topics:
• What Is the Default Directive?
• How Directives are Applied to Code?
Chapter 2
Understanding Directives
2-11

• Compiler Control and Backward Compatibility
What Is the Default Directive?
The default directive is a compiler directive that contains default values for all possible
directive options. It is the bottom-most directives in the stack and matches every
method submitted for compilation.
When you design a new compiler directive, you specify how the new directive differs
from the default directive. The default directive becomes a template to guide your
design decisions.
Directive Option Values in the Default Directive
You can print an empty directive stack to reveal the matching criteria and the values
for all directive options in the default compiler directive:
Directive: (default)
matching: *.*
c1 directives:
inline: -
Enable:true Exclude:false BreakAtExecute:false BreakAtCompile:false
Log:false PrintAssembly:false PrintInlining:false PrintNMethods:false
BackgroundCompilation:true ReplayInline:false DumpReplay:false
DumpInline:false CompilerDirectivesIgnoreCompileCommands:false
DisableIntrinsic: BlockLayoutByFrequency:true PrintOptoAssembly:false
PrintIntrinsics:false TraceOptoPipelining:false TraceOptoOutput:false
TraceSpilling:false Vectorize:false VectorizeDebug:0
CloneMapDebug:false IGVPrintLevel:0 MaxNodeLimit:80000
c2 directives:
inline: -
Enable:true Exclude:false BreakAtExecute:false BreakAtCompile:false
Log:false PrintAssembly:false PrintInlining:false PrintNMethods:false
BackgroundCompilation:true ReplayInline:false DumpReplay:false
DumpInline:false CompilerDirectivesIgnoreCompileCommands:false
DisableIntrinsic: BlockLayoutByFrequency:true PrintOptoAssembly:false
PrintIntrinsics:false TraceOptoPipelining:false TraceOptoOutput:false
TraceSpilling:false Vectorize:false VectorizeDebug:0
CloneMapDebug:false IGVPrintLevel:0 MaxNodeLimit:80000
Note:
Certain options are applicable exclusively to the
c2
compiler. For a complete
list, see Table 2-2.
Directive Option Values in New Directives
In a new directives, you must specify how the directive differs from the default
directive. If you don’t specify a directive option, then that option retains the value from
the default directive.
Chapter 2
Understanding Directives
2-12

Example:
[
{
match: ["*Concurrent.*"],
c2: {
MaxNodeLimit: 1000,
},
Exclude:true,
},
]
When you add a new directive to the directives stack, the default directive becomes
the bottom-most directive in the stack. See How Directives Are Ordered in the
Directives Stack? for a description of this process. For this example, when you print
the directives stack, it shows how the directive options specified in the new directive
differ from the values in the default directive:
Directive:
matching: *Concurrent.*
c1 directives:
inline: -
Enable:true Exclude:true BreakAtExecute:false BreakAtCompile:false
Log:false PrintAssembly:false PrintInlining:false PrintNMethods:false
BackgroundCompilation:true ReplayInline:false DumpReplay:false
DumpInline:false CompilerDirectivesIgnoreCompileCommands:false
DisableIntrinsic: BlockLayoutByFrequency:true PrintOptoAssembly:false
PrintIntrinsics:false TraceOptoPipelining:false TraceOptoOutput:false
TraceSpilling:false Vectorize:false VectorizeDebug:0
CloneMapDebug:false IGVPrintLevel:0 MaxNodeLimit:80000
c2 directives:
inline: -
Enable:true Exclude:true BreakAtExecute:false BreakAtCompile:false
Log:false PrintAssembly:false PrintInlining:false PrintNMethods:false
BackgroundCompilation:true ReplayInline:false DumpReplay:false
DumpInline:false CompilerDirectivesIgnoreCompileCommands:false
DisableIntrinsic: BlockLayoutByFrequency:true PrintOptoAssembly:false
PrintIntrinsics:false TraceOptoPipelining:false TraceOptoOutput:false
TraceSpilling:false Vectorize:false VectorizeDebug:0
CloneMapDebug:false IGVPrintLevel:0 MaxNodeLimit:1000
Directive: (default)
matching: *.*
c1 directives:
inline: -
Enable:true Exclude:false BreakAtExecute:false BreakAtCompile:false
Log:false PrintAssembly:false PrintInlining:false PrintNMethods:false
BackgroundCompilation:true ReplayInline:false DumpReplay:false
DumpInline:false CompilerDirectivesIgnoreCompileCommands:false
DisableIntrinsic: BlockLayoutByFrequency:true PrintOptoAssembly:false
PrintIntrinsics:false TraceOptoPipelining:false TraceOptoOutput:false
TraceSpilling:false Vectorize:false VectorizeDebug:0
Chapter 2
Understanding Directives
2-13

CloneMapDebug:false IGVPrintLevel:0 MaxNodeLimit:80000
c2 directives:
inline: -
Enable:true Exclude:false BreakAtExecute:false BreakAtCompile:false
Log:false PrintAssembly:false PrintInlining:false PrintNMethods:false
BackgroundCompilation:true ReplayInline:false DumpReplay:false
DumpInline:false CompilerDirectivesIgnoreCompileCommands:false
DisableIntrinsic: BlockLayoutByFrequency:true PrintOptoAssembly:false
PrintIntrinsics:false TraceOptoPipelining:false TraceOptoOutput:false
TraceSpilling:false Vectorize:false VectorizeDebug:0
CloneMapDebug:false IGVPrintLevel:0 MaxNodeLimit:80000
How Directives are Applied to Code?
A directive is applied to code based on a method matching process. Every method
submitted for compilation is matched with a directive in the directives stack.
The process of matching a method with a directive in the directives stack is performed
by the CompilerBroker.
The Method Matching Process
When a method is submitted for compilation, the fully qualified name of the method
is compared with the matching criteria in the directives stack. The first directive in the
stack that matches is applied to the method. The remaining directives in the stack are
ignored. If no match is found, then the default directive is applied.
This process is repeated for all methods in a compilation. More than one directive
can be applied in a compilation, but only one directive is applied to each method. All
directives in the stack are considered active because they are potentially applicable.
The key differences between active and applied directives are:
• A directive is active if it’s present in the directives stack.
• A directive is applied if it’s affecting code.
Example 2-1 When a Match Is Found
The following example shows a method submitted for compilation:
public int exampleMethod(int x){
return x;
}
Based on method-matching criteria,
Directive 2
is applied from the following
example directive stack:
Directive 2:
matching: *.*example*
Directive 1:
matching: *.*exampleMethod*
Directive 0: (default)
matching: *.*
Chapter 2
Understanding Directives
2-14

Example 2-2 When No Match Is Found
The following example shows a method submitted for compilation:
public int otherMethod(int y){
return y;
}
Based on method-matching criteria,
Directive 0
(the default directive) is applied from
the following example directive stack:
Directive 2:
matching: *.*example*
Directive 1:
matching: *.*exampleMethod*
Directive 0: (default)
matching: *.*
Guidelines for Writing a New Directive
• No feedback mechanism is provided to verify which directive is applied to a given
method. Instead, a profiler such as Java Management Extensions (JMX) is used to
measure the cumulative effects of applied directives.
• The CompilerBroker ignores directive options that create bad code, such as
forcing hardware instructions on a platform that doesn't offer support. A warning
message is displayed.
• Directive options have the same limitations as typical command-line flags. For
example, the instructions to inline code are followed only if the Intermediate
Representation (IR) doesn’t become too large.
Compiler Control and Backward Compatibility
CompileCommand and command-line flags can be used alongside Compiler Control
directives.
Although Compiler Control can replace CompileCommand, backward compatibility is
provided. It’s possible to utilize both at the same time. Compiler Control receives
priority. Conflicts are handled based on the following prioritization:
1. Compiler Control
2. CompileCommand
3. Command-line flags
4. Default values
Example 2-3 Mixing Compiler Control and CompileCommand
The following list shows a small number of compilation options and values:
• Compiler Control:
–
Exclude: true
–
BreakAtExecute: false
• CompileCommand:
Chapter 2
Understanding Directives
2-15

–
BreakAtExecute: true
–
BreakAtCompile: true
• Default values:
–
Exclude: false
–
BreakAtExecute: false
–
BreakAtCompile: false
–
Log: false
For the options and values in this example, the resulting compilation is determined by
using the rules for handling backward compatibility conflicts:
•
Exclude: true
•
BreakAtExecute: false
•
BreakAtCompile: true
•
Log: false
Commands for Working with Directive Files
This topic examines commands and the effects of working with completed directive
files.
• Compiler Directives and the Command Line
• Compiler Directives and Diagnostic Commands
• How Directives Are Ordered in the Directives Stack?
Compiler Directives and the Command Line
You can use the command-line interface to add and print compiler directives while
starting a program.
You can specify only one directives file at the command line. All directives within that
file are added to the directives stack and are immediately active when the program
starts. Adding directives at the command line enables you to test the performance
effects of directives during a program’s early stages. You can also focus on debugging
and developing your program.
Adding Directives Through the Command Line
The following command-line option specifies a directives file:
XX:CompilerDirectivesFile=file
Include this command-line option when you start a Java program. The following
example shows this option, which starts
TestProgram
:
java -XX:+UnlockDiagnosticVMOptions -
XX:CompilerDirectivesFile=File_A.json TestProgram
In the example:
Chapter 2
Commands for Working with Directive Files
2-16

•
-XX:+UnlockDiagnosticVMOptions
enables diagnostic options. You must enter
this before you add directives at the command line.
•
-XX:CompilerDirectivesFile
is a type of diagnostic option. You can use it to
specify one directives file to add to the directives stack.
•
File_A.json
is a directives file. The file can contain multiple directives, all of which
are added to the stack of active directives when the program starts.
• If
File_A.json
contains syntax errors or malformed directives, then an error
message is displayed and
TestProgram
does not start.
Printing Directives Through the Command Line
You can automatically print the directives stack when a program starts or
when additional directives are added through diagnostic commands. The following
command-line option to enables this behavior:
-XX:+CompilerDirectivesPrint
The following example shows how to include this diagnostic command at the
command line:
java -XX:+UnlockDiagnosticVMOptions -XX:+CompilerDirectivesPrint -
XX:CompilerDirectivesFile=File_A.json TestProgram
Compiler Directives and Diagnostic Commands
You can use diagnostic commands to manage which directives are active at runtime.
You can add or remove directives without restarting a running program.
Crafting a single perfect directives file might take some iteration and experimentation.
Diagnostic commands provide powerful mechanisms for testing different configurations
of directives in the directives stack. Diagnostic commands let you add or remove
directives without restarting a running program’s JVM.
Getting Your Java Process Identification Number
To test directives you must find the processor identifier (PID) number of your running
program.
1. Open a terminal.
2. Enter the jcmd command.
The jcmd command returns a list of the Java process that are running, along with their
PID numbers. In the following example, the information returned about
TestProgram
:
11084 TestProgram
Adding Directives Through Diagnostic Commands
You can add all directives in a file to the directives stack through the following
diagnostic command.
Chapter 2
Commands for Working with Directive Files
2-17

Syntax:
jcmd pid Compiler.directives_add file
The following example shows a diagnostic command:
jcmd 11084 Compiler.directives_add File_B.json
The terminal reports the number of individual directives added. If the directives file
contains syntax errors or malformed directives, then an error message is displayed,
and no directives from the file are added to the stack, and no changes are made to the
running program.
Removing Directives Through Diagnostic Commands
You can remove directives by using diagnostic commands.
To remove the top-most, individual directive from the directive stack, enter:
jcmd pid Compiler.directives_remove
To clear every directive you added to the directives stack, enter:
jcmd pid Compiler.directives_clear
It’s not possible to specify an entire file of directives to remove, nor is any other way
available to remove directives in bulk.
Printing Directives Through Diagnostic Commands
You can use diagnostic commands to print the directives stack of a running program.
To print a detailed description of the full directives stack, enter:
jcmd pid Compiler.directives_print
Example output is shown in What Is the Default Directive?
How Directives Are Ordered in the Directives Stack?
The order of the directives in a directives file, and in the directives is very important.
The top-most, best-matching directive in the stack receives priority and is applied to
code compilation.
The following examples illustrate the order of directive files in an example directives
stack. The directive files in the examples contain the following directives :
•
File_A
contains
Directive 1
and
Directive 2
.
•
File_B
contains
Directive 3
.
•
File_C
contains
Directive 4
and
Directive 5
.
Chapter 2
Commands for Working with Directive Files
2-18

Starting an Application With or Without Directives
You can start the
TestProgram
without specifying the directive files.
• To start
TestProgram
without adding any directives, at the command line, enter the
following command:
java TestProgram
•
TestProgram
starts without any directives file specified.
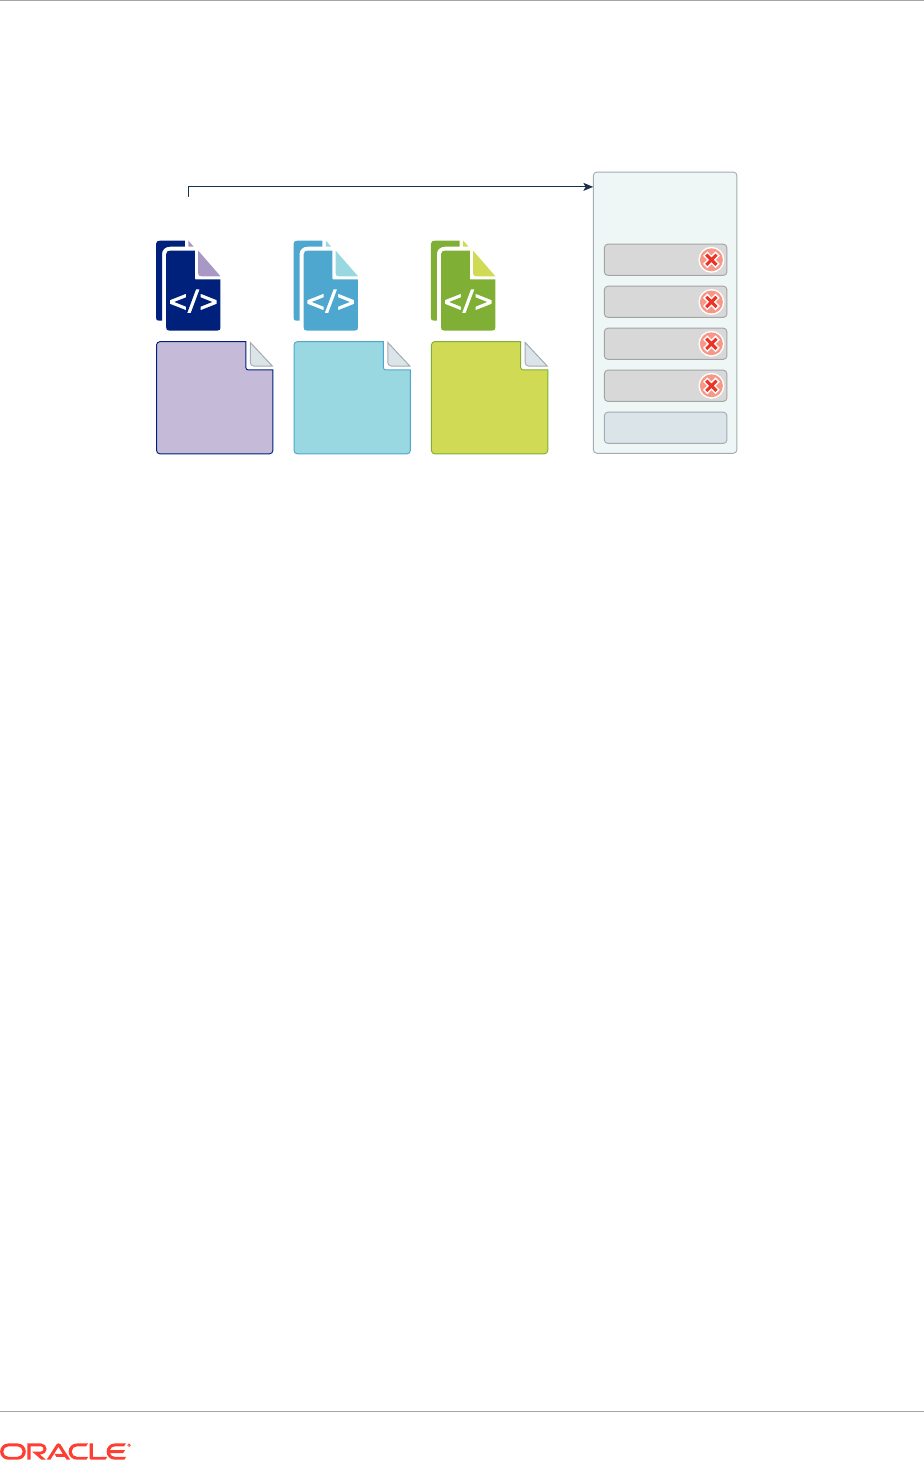
• The default directive is always the bottom-most directive in the directives stack.
Figure 2-1 shows the default directive as
Directive 0
. When you don’t specify
a directives file, the default directive is also the top-most directive and it receives
priority.
Figure 2-1 Starting a Program Without Directives
File_A
[
Directive 1
Directive 2
]
File_B
[
Directive 3
]
File_C
[
Directive 4
Directive 5
]
Directives Stack
Directive 0
java TestProgram
You can start an application and specify directives.
• To start the
TestProgram
application and add the directives from
File_A.json
to
the directives stack, at the command line, enter the following command:
java -XX:+UnlockDiagnosticVMOptions -
XX:CompilerDirectivesFile=File_A.json TestProgram
•
TestProgram
starts and the directives in
File_A
are added to the stack. The top-
most directive in the directives file becomes the top-most directive in the directives
stack.
• Figure 2-2 shows that the order of directives in the stack, from top to bottom,
becomes is [1, 2, 0].
Chapter 2
Commands for Working with Directive Files
2-19

Figure 2-2 Starting a Program with Directives
File_A
[
Directive 1
Directive 2
]
File_B
[
Directive 3
]
File_C
[
Directive 4
Directive 5
]
Directives Stack
Directive 2
Directive 0
Directive 1
-XX: CompilerDirectivesFile=File_A.json
Adding Directives to a Running Application
You can add directives to a running application through diagnostic commands.
• To to add all directives from
File_B
to the directives stack, enter the following
command:
jcmd 11084 Compiler.directives_add File_B.json
The directive in
File_B
is added to the top of the stack.
• Figure 2-3 shows that the order of directives in the stack becomes is [3, 1, 2, 0].
Figure 2-3 Adding a Directive to a Running Program
File_A
[
Directive 1
Directive 2
]
File_B
[
Directive 3
]
File_C
[
Directive 4
Directive 5
]
Directives Stack
Directive 3
Directive 2
Directive 0
Directive 1
Compiler.directives_add File_B.json
You can add directive files through diagnostic commands to the
TestProgram
while it is
running:
• To add all directives from
File_C
to the directives stack, enter the following
command.
jcmd 11084 Compiler.directives_add File_C.json
• Figure 2-4 shows that the order of directives in the stack becomes is [4, 5, 3, 1, 2,
0].
Chapter 2
Commands for Working with Directive Files
2-20

Figure 2-4 Adding multiple Directives to a Running Program
File_A
[
Directive 1
Directive 2
]
File_B
[
Directive 3
]
File_C
[
Directive 4
Directive 5
]
Directives Stack
Directive 4
Directive 5
Directive 3
Directive 2
Directive 0
Directive 1
Compiler.directives_add File_C.json
Removing Directives from the Directives Stack
You can remove the top-most directive from the directive stacks through diagnostic
commands.
• To remove
Directive 4
from the stack, enter the following command:
jcmd 11084 Compiler.directives_remove
• To remove more, repeat this diagnostic command until only the default directive
remains. You can’t remove the default directive.
• Figure 2-5 shows that the order of directives in the stack becomes is [5, 3, 1, 2, 0].
Figure 2-5 Removing One Directive from the Stack
File_A
[
Directive 1
Directive 2
]
File_B
[
Directive 3
]
File_C
[
Directive 4
Directive 5
]
Directives Stack
Directive 4
Directive 5
Directive 3
Directive 2
Directive 0
Directive 1
Compiler.directives_remove
You can remove multiple directives from the directives stack.
• To clear the directives stack, enter the following command:
jcmd 11084 Compiler.directives_clear
• All directives are removed except the default directive. You can’t remove the
default directive.
Chapter 2
Commands for Working with Directive Files
2-21
• Figure 2-6 shows that only
Directive 0
remains in the stack.
Figure 2-6 Removing All Directives from the Stack
File_A
[
Directive 1
Directive 2
]
File_B
[
Directive 3
]
File_C
[
Directive 4
Directive 5
]
Directives Stack
Directive 5
Directive 3
Directive 2
Directive 0
Directive 1
Compiler.directives_clear
Chapter 2
Commands for Working with Directive Files
2-22

3
Garbage Collection
Oracle’s HotSpot VM includes several garbage collectors that you can use to help
optimize the performance of your application. A garbage collector is especially helpful
if your application handles large amounts of data (multiple gigabytes), has many
threads, and has high transaction rates.
For descriptions on the available garbage collectors, see Garbage Collection
Implementation in the Java Platform, Standard Edition HotSpot Virtual Machine
Garbage Collection Tuning Guide.
3-1

4
Class Data Sharing
This chapter describes the class data sharing (CDS) feature that can help reduce the
startup time and memory footprints for Java applications.
Topics:
• Class Data Sharing
• Regenerating the Shared Archive
• Manually Controlling Class Data Sharing
Class Data Sharing
The Class data sharing (CDS) feature helps reduce the startup time and memory
footprint between multiple Java Virtual Machines (JVM).
Starting from JDK 12, a default CDS archive is pre-packaged with the Oracle
JDK binary. The default CDS archive is created at the JDK build time by running
-Xshare:dump
, using G1 GC and 128M Java heap. It uses a built-time generated
default class list that contains the selected core library classes. The default CDS
archive resides in the following location:
• On Linux and macOS platforms, the shared archive is stored in /lib/[arch]/
server/classes.jsa
• On Windows platforms, the shared archive is stored in /bin/server/
classes.jsa
By default, the default CDS archive is enabled at the runtime. Specify
-Xshare:off
to disable the default shared archive. See Regenerating the Shared Archive to create
a customized shared archive. Use the same Java heap size for both dump time and
runtime while creating and using a customized shared archive.
When the JVM starts, the shared archive is memory-mapped to allow sharing of
read-only JVM metadata for these classes among multiple JVM processes. Because
accessing the shared archive is faster than loading the classes, startup time is
reduced.
Class data sharing is supported with the G1, serial, parallel, and parallelOldGC
garbage collectors. The shared Java heap object feature (part of class data sharing)
supports only the G1 garbage collector on 64-bit non-Windows platforms.
The primary motivation for including CDS in Java SE is to decrease in startup time.
The smaller the application relative to the number of core classes it uses, the larger
the saved fraction of startup time.
The footprint cost of new JVM instances has been reduced in two ways:
1. A portion of the shared archive on the same host is mapped as read-only and
shared among multiple JVM processes. Otherwise, this data would need to be
4-1

replicated in each JVM instance, which would increase the startup time of your
application.
2. The shared archive contains class data in the form that the Java Hotspot VM
uses it. The memory that would otherwise be required to access the original class
information in the runtime modular image, is not used. These memory savings
allow more applications to be run concurrently on the same system. In Windows
applications, the memory footprint of a process, as measured by various tools,
might appear to increase, because more pages are mapped to the process’s
address space. This increase is offset by the reduced amount of memory (inside
Windows) that is needed to hold portions on the runtime modular image. Reducing
footprint remains a high priority.
Application Class-Data Sharing
To further reduce the startup time and the footprint, Application Class-Data Sharing
(AppCDS) is introduced that extends the CDS to include selected classes from the
application class path.
This feature allows application classes to be placed in a shared drive. The common
class metadata is shared across different Java processes. AppCDS allows the built-in
system class loader, built-in platform class loader, and custom class loaders to load
the archived classes. When multiple JVMs share the same archive file, memory is
saved and the overall system response time improves.
See Application Class Data Sharing in Java Development Kit Tool Specifications.
Dynamic CDS Archive
Dynamic CDS archive extends application class-data sharing (AppCDS) to allow
dynamic archiving of classes when a Java application exits.
It simplifies AppCDS usage by eliminating the trial runs to create a class list for each
application. The archived classes include all loaded application classes and library
classes that are not present in the default CDS archive.
To create a dynamic CDS archive, run the Java application with the following
command:
java -XX:ArchiveClassesAtExit=<dynamic archive> -cp <app jar> MyApp
See Dynamic CDS Archive in Java Development Kit Tool Specifications.
Regenerating the Shared Archive
You can regenerate the shared archive for all supported platforms.
The default class list that is installed with the JDK contains only a small set of core
library classes. You might want to include other classes in the shared archive. To
create a dynamic CDS archive with the default CDS archive as the base archive, add
the following option in the command line:
java -XX:ArchiveClassesAtExit=<dynamic archive>
Chapter 4
Regenerating the Shared Archive
4-2

A separate dynamically-generated archive is created on top of the default system for
each application. You can specify the name of the dynamic archive as an argument to
the
-XX:ArchiveClassesAtExit
option.
To regenerate the archive file log in as the administrator. In networked situations, log
in to a computer of the same architecture as the Java SE installation. Ensure that you
have permissions to write to the installation directory.
To regenerate the shared archive by using a user defined class list, enter the following
command:
java -XX:SharedClassListFile=<class_list_file> -Xshare:dump
Diagnostic information is printed when the archive is generated.
Manually Controlling Class Data Sharing
Class data sharing is enabled by default. You can manually enable and disable this
feature.
You can use the following command-line options for diagnostic and debugging
purposes.
-Xshare:off
To disable class data sharing.
-Xshare:on
To enable class data sharing. If class data sharing can't be enabled, print an error
message and exit.
Note:
The
-Xshare:on
is for testing purposes only and may cause intermittent
failures due to the use of address space layout randomization by
the operating system. This option should not be used in production
environments.
-Xshare:auto
To enable class data sharing by default. Enable class data sharing whenever
possible.
Chapter 4
Manually Controlling Class Data Sharing
4-3

5
Java HotSpot Virtual Machine Performance
Enhancements
This chapter describes the performance enhancements in the Oracle’s HotSpot Virtual
Machine technology.
Topics:
• Compact Strings
• Tiered Compilation
• Compressed Ordinary Object Pointer
• Graal : a Java-Based JIT Compiler
• Ahead-of-Time Compilation
• Zero-Based Compressed Ordinary Object Pointers
• Escape Analysis
Compact Strings
The compact strings feature introduces a space-efficient internal representation for
strings.
Data from different applications suggests that strings are a major component of Java
heap usage and that most
java.lang.String
objects contain only Latin-1 characters.
Such characters require only one byte of storage. As a result, half of the space in
the internal character arrays of
java.lang.String
objects are not used. The compact
strings feature, introduced in Java SE 9 reduces the memory footprint, and reduces
garbage collection activity. This feature can be disabled if you observe performance
regression issues in an application.
The compact strings feature does not introduce new public APIs or interfaces. It
modifies the internal representation of the
java.lang.String
class from a UTF-16
(two bytes) character array to a byte array with an additional field to identify
character encoding. Other string-related classes, such as
AbstractStringBuilder
,
StringBuilder
, and
StringBuffer
are updated to use a similar internal
representation.
In Java SE 9, the compact strings feature is enabled by default. Therefore, the
java.lang.String
class stores characters as one byte for each character, encoded
as Latin-1. The additional character encoding field indicates the encoding that is used.
The HotSpot VM string intrinsics are updated and optimized to support the internal
representation.
You can disable the compact strings feature by using the
-XX:-CompactStrings
flag
with the
java
command line. When the feature is disabled, the
java.lang.String
class stores characters as two bytes, encoded as UTF-16, and the HotSpot VM string
intrinsics to use UTF-16 encoding.
5-1

Tiered Compilation
Tiered compilation, introduced in Java SE 7, brings client VM startup speeds to
the server VM. Without tired compilation, a server VM uses the interpreter to
collect profiling information about methods that is sent to the compiler. With tiered
compilation, the server VM also uses the client compiler to generate compiled versions
of methods that collect profiling information about themselves. The compiled code
is substantially faster than the interpreter, and the program executes with greater
performance during the profiling phase. Often, startup is faster than the client VM
startup speed because the final code produced by the server compiler might be
available during the early stages of application initialization. Tiered compilation can
also achieve better peak performance than a regular server VM, because, the faster
profiling phase allows a longer period of profiling, which can yield better optimization.
Tiered compilation is enabled by default for the server VM. The 64-bit mode
and Compressed Ordinary Object Pointer are supported. You can disable tiered
compilation by using the
-XX:-TieredCompilation
flag with the
java
command.
To accommodate the additional profiling code that is generated with tiered compilation,
the default size of code cache is multiplied by 5x. To organize and manage the larger
space effectively, segmented code cache is used.
Segmented Code Cache
The code cache is the area of memory where the Java Virtual Machine stores
generated native code. It is organized as a single heap data structure on top of a
contiguous chunk of memory.
Instead of having a single code heap, the code cache is divided into segments,
each containing compiled code of a particular type. This segmentation provides better
control of the JVM memory footprint, shortens scanning time of compiled methods,
significantly decreases the fragmentation of code cache, and improves performance.
The code cache is divided into the following three segments:
Table 5-1 Segmented Code Cache
Code Cache
Segments
Description JVM Command-Line Arguments
Non-method This code heap contains
non-method code such
as compiler buffers and
bytecode interpreter. This
code type stays in the code
cache forever. The code
heap has a fixed size of
3 MB and remaining code
cache is distributed evenly
among the profiled and
non-profiled code heaps.
-XX:NonMethodCodeHeapSize
Profiled This code heap contains
lightly optimized, profiled
methods with a short
lifetime.
–XX:ProfiledCodeHeapSize
Chapter 5
Tiered Compilation
5-2

Table 5-1 (Cont.) Segmented Code Cache
Code Cache
Segments
Description JVM Command-Line Arguments
Non-profiled This code heap contains
fully optimized, non-
profiled methods with a
potentially long lifetime.
-XX:NonProfiledCodeHeapSize
Graal : a Java-Based JIT Compiler
Graal is a high-performance, optimizing, just-in-time compiler written in Java that
integrates with Java HotSpot VM. It’s a customizable dynamic compiler that you can
invoke from Java.
Some of the features and benefits of Graal include:
• Flexible speculative optimizations
• Better inlining
• Partial escape analysis
• Benefits from Java tooling and IDE support
• Metacircular approach that allows for tighter code generation control
You can use Graal in the static context as well. The static Ahead of Time Compiler is
based on the Graal framework.
Graal is part of the JDK build and it is delivered as an internal module,
jdk.internal.vm.compiler
. It communicates with the JVM using the JVM Compiler
Interface (JVMCI). The JVMCI is also part of the JDK build and it is contained within
the internal module:
jdk.internal.vm.ci
.
To enable Graal as the JIT compiler, use the following option on the
java
command
line:
-XX:+UnlockExperimentalVMOptions -XX:+UseJVMCICompiler
Note:
Graal is an experimental feature and is supported only on Linux-x64.
Ahead-of-Time Compilation
Ahead-of-time (AOT) compilation improves the startup time of small and large Java
applications by compiling the Java classes to native code before launching the virtual
machine.
Though just-in-time (JIT) compilers are fast, it takes time to compile large Java
programs. Also, when certain Java methods that are not compiled are interpreted
repeatedly, performance is affected. AOT addresses these issues.
Chapter 5
Graal : a Java-Based JIT Compiler
5-3

A new tool
jaotc
is used for AOT compilation. The syntax of the
jaotc
tool is as
follows:
jaotc <options> <list of classes or jar files>
jaotc <options> <--module name>
For example:
jaotc --output libHelloWorld.so HelloWorld.class
jaotc --output libjava.base.so --module java.base
The
jaotc
tool is part of Java installation, similar to
javac
.
Specify the generated AOT library while application execution:
java -XX:AOTLibrary=./libHelloWorld.so,./libjava.base.so HelloWorld
When JVM startup, the AOT initialization code looks for the libraries specified using
the
AOTLibrary
flag. If the libraries are not found, then the AOT is turned off for that
JVM instance.
See Java Development Kit Tool Specifications for details on
jaotc
tool.
Note:
Ahead-of-Time (AOT) compilation is an experimental feature and is
supported only on Linux-x64.
Compressed Ordinary Object Pointer
An ordinary object pointer (oop) in Java Hotspot parlance, is a managed pointer to
an object. Typically, an oop is the same size as a native machine pointer, which is
64-bit on an LP64 system. On an ILP32 system, maximum heap size is less than 4
gigabytes, which is insufficient for many applications. On an LP64 system, the heap
used by a given program might have to be around 1.5 times larger than when it is
run on an ILP32 system. This requirement is due to the expanded size of managed
pointers. Memory is inexpensive, but these days bandwidth and cache are in short
supply, so significantly increasing the size of the heap and only getting just over the 4
gigabyte limit is undesirable.
Managed pointers in the Java heap point to objects that are aligned on 8-byte address
boundaries. Compressed oops represent managed pointers (in many but not all places
in the Java Virtual Machine (JVM) software) as 32-bit object offsets from the 64-bit
Java heap base address. Because they're object offsets rather than byte offsets, oops
can be used to address up to four billion objects (not bytes), or a heap size of up to
about 32 gigabytes. To use them, they must be scaled by a factor of 8 and added to
the Java heap base address to find the object to which they refer. Object sizes using
compressed oops are comparable to those in ILP32 mode.
Chapter 5
Compressed Ordinary Object Pointer
5-4

The term decode refer to the operation by which a 32-bit compressed oop is converted
to a 64-bit native address and added into the managed heap. The term encode refers
to that inverse operation.
Compressed oops is supported and enabled by default in Java SE 6u23 and later.
In Java SE 7, compressed oops is enabled by default for 64-bit JVM processes
when
-Xmx
isn't specified and for values of
-Xmx
less than 32 gigabytes. For JDK
releases earlier than 6u23 release, use the
-XX:+UseCompressedOops
flag with the
java
command to enable the compressed oops.
Zero-Based Compressed Ordinary Object Pointers
When the JVM uses compressed ordinary object pointers (oops) in a 64-bit JVM
process, the JVM software sends a request to the operating system to reserve
memory for the Java heap starting at virtual address zero. If the operating system
supports such a request and can reserve memory for the Java heap at virtual address
zero, then zero-based compressed oops are used.
When zero-based compressed oops are used, a 64-bit pointer can be decoded from a
32-bit object offset without including the Java heap base address. For heap sizes less
than 4 gigabytes, the JVM software can use a byte offset instead of an object offset
and thus also avoid scaling the offset by 8. Encoding a 64-bit address into a 32-bit
offset is correspondingly efficient.
For Java heap sizes up to 26 gigabytes, the Linux and Windows operating systems
typically can allocate the Java heap at virtual address zero.
Escape Analysis
Escape analysis is a technique by which the Java HotSpot Server Compiler can
analyze the scope of a new object's uses and decide whether to allocate the object on
the Java heap.
Escape analysis is supported and enabled by default in Java SE 6u23 and later.
The Java HotSpot Server Compiler implements the flow-insensitive escape analysis
algorithm described in:
[Choi99] Jong-Deok Choi, Manish Gupta, Mauricio Seffano,
Vugranam C. Sreedhar, Sam Midkiff,
"Escape Analysis for Java", Procedings of ACM SIGPLAN
OOPSLA Conference, November 1, 1999
An object's escape state, based on escape analysis, can be one of the following
states:
•
GlobalEscape
: The object escapes the method and thread. For example, an object
stored in a static field, stored in a field of an escaped object, or returned as the
result of the current method.
•
ArgEscape
: The object is passed as an argument or referenced by an argument
but does not globally escape during a call. This state is determined by analyzing
the bytecode of the called method.
Chapter 5
Zero-Based Compressed Ordinary Object Pointers
5-5

•
NoEscape
: The object is a scalar replaceable object, which means that its
allocation could be removed from generated code.
After escape analysis, the server compiler eliminates the scalar replaceable object
allocations and the associated locks from generated code. The server compiler also
eliminates locks for objects that do not globally escape. It does not replace a heap
allocation with a stack allocation for objects that do not globally escape.
The following examples describe some scenarios for escape analysis:
• The server compiler might eliminate certain object allocations. For example, a
method makes a defensive copy of an object and returns the copy to the caller.
public class Person {
private String name;
private int age;
public Person(String personName, int personAge) {
name = personName;
age = personAge;
}
public Person(Person p) { this(p.getName(), p.getAge()); }
public int getName() { return name; }
public int getAge() { return age; }
}
public class Employee {
private Person person;
// makes a defensive copy to protect against modifications
by caller
public Person getPerson() { return new Person(person) };
public void printEmployeeDetail(Employee emp) {
Person person = emp.getPerson();
// this caller does not modify the object, so defensive
copy was unnecessary
System.out.println ("Employee's name: " +
person.getName() + "; age: " + person.getAge());
}
}
The method makes a copy to prevent modification of the original object by the
caller. If the compiler determines that the
getPerson
method is being invoked in a
loop, then the compiler inlines that method. By using escape analysis, when the
compiler determines that the original object is never modified, the compiler can
optimize and eliminate the call to make a copy.
• The server compiler might eliminate synchronization blocks (lock elision) if it
determines that an object is thread local. For example, methods of classes such
as
StringBuffer
and
Vector
are synchronized because they can be accessed
by different threads. However, in most scenarios, they are used in a thread local
manner. In cases where the usage is thread local, the compiler can optimize and
remove the synchronization blocks.
Chapter 5
Escape Analysis
5-6

6
JVM Constants API
The JVM Constants API is defined in the package
java.lang.constants
, which
contains the nominal descriptors of various types of loadable constants. These
nominal descriptors are useful for applications that manipulate class files and compile-
time or link-time program analysis tools.
A nominal descriptor is not the value of a loadable constant but a description of its
value, which can be reconstituted given a class loading context. A loadable constant
is a constant pool entry that can be pushed onto the operand stack or can appear in
the static argument list of a bootstrap method for the
invokedynamic
instruction. The
operand stack is where JVM instructions get their input and store their output. Every
Java class file has a constant pool, which contains several kinds of constants, ranging
from numeric literals known at compile-time to method and field references that must
be resolved at run-time.
The issue with working with non-nominal loadable constants, such as a
Class
objects,
whose references are resolved at run-time, is that these references depend on the
correctness and consistency of the class loading context. Class loading may have side
effects, such as running code that you don't want run and throwing access-related and
out-of-memory exceptions, which you can avoid with nominal descriptions. In addition,
class loading may not be possible at all.
See the package
java.lang.constant
.
6-1

7
Support for Non-Java Languages
This chapter describes the Non-Java Language features in the Java Virtual Machine.
Topics:
• Introduction to Non-Java Language Features
• Static and Dynamic Typing
• The Challenge of Compiling Dynamically-Typed Languages
• The invokedynamic Instruction
Introduction to Non-Java Language Features
The Java Platform, Standard Edition (Java SE) enables the development of
applications that have the following features:
• They can be written once and run anywhere
• They can be run securely because of the Java sandbox security model
• They are easy to package and deliver
The Java SE platform provides robust support in the following areas:
• Concurrency
• Garbage collection
• Reflective access to classes and objects
• JVM Tool Interface (JVM TI): A native programming interface for use by tools.
It provides both a way to inspect the state and to control the execution of
applications running in the JVM.
Oracle's HotSpot JVM provides the following tools and features:
• DTrace: A dynamic tracing utility that monitors the behavior of applications and the
operating system.
• Performance optimizations
• PrintAssembly: A Java HotSpot option that prints assembly code for bytecoded
and native methods.
The Java SE 7 platform enables non-Java languages to use the infrastructure
and potential performance optimizations of the JVM. The key mechanism is the
invokedynamic
instruction, which simplifies the implementation of compilers and
runtime systems for dynamically-typed languages on the JVM.
7-1

Static and Dynamic Typing
A programming language is statically-typed if it performs type checking at compile
time. Type checking is the process of verifying that a program is type safe. A program
is type safe if the arguments of all of its operations are the correct type.
Java is a statically-typed language. Type information is available for class and instance
variables, method parameters, return values, and other variables when a program is
compiled. The compiler for the Java programming language uses this type information
to produce strongly typed bytecode, which can then be efficiently executed by the JVM
at runtime.
The following example of a Hello World program demonstrates static typing. Types are
shown in bold.
import java.util.Date;
public class HelloWorld {
public static void main(String[] argv) {
String hello = "Hello ";
Date currDate = new Date();
for (String a : argv) {
System.out.println(hello + a);
System.out.println("Today's date is: " + currDate);
}
}
}
A programming language is dynamically-typed if it performs type checking at runtime.
JavaScript and Ruby are examples of dynamically typed languages. These languages
verify at runtime, rather than at compile time, that values in an application conform to
expected types. Typically, type information for these languages is not available when
an application is compiled. The type of an object is determined only at runtime. In the
past, it was difficult to efficiently implement dynamically-typed languages on the JVM.
The following is an example of the Hello World program written in the Ruby
programming language:
#!/usr/bin/env ruby
require 'date'
hello = "Hello "
currDate = DateTime.now
ARGV.each do|a|
puts hello + a
puts "Date and time: " + currDate.to_s
end
In the example, every name is introduced without a type declaration. The main
program is not located inside a holder type (the Java class
HelloWorld
). The Ruby
equivalent of the Java
for
loop is inside the dynamic type
ARGV
variable. The body
Chapter 7
Static and Dynamic Typing
7-2

of the loop is contained in a block called a closure, which is a common feature in
dynamic languages.
Statically-Typed Languages Are Not Necessarily Strongly-Typed
Languages
Statically-typed programming languages can employ strong typing or weak typing. A
programming language that employs strong typing specifies restrictions on the types
of values supplied to its operations, and it prevents the execution of an operation if its
arguments have the wrong type. A language that employs weak typing would implicitly
convert (or cast) arguments of an operation if those arguments have the wrong or
incompatible types.
Dynamically-typed languages can employ strong typing or weak typing. For example,
the Ruby programming language is dynamically-typed and strongly-typed. When a
variable is initialized with a value of some type, the Ruby programming language does
not implicitly convert the variable into another data type.
In the following example, the Ruby programming language does not implicitly cast the
number 2, which has a
Fixnum
type, to a string.
a = "40"
b = a + 2
The Challenge of Compiling Dynamically-Typed Languages
Consider the following dynamically-typed method,
addtwo
, which adds any two
numbers (which can be of any numeric type) and returns their sum:
def addtwo(a, b)
a + b;
end
Suppose your organization is implementing a compiler and runtime system for the
programming language in which the method
addtwo
is written. In a strongly-typed
language, whether typed statically or dynamically, the behavior of
+
(the addition
operator) depends on the operand types. A compiler for a statically-typed language
chooses the appropriate implementation of
+
based on the static types of
a
and
b
. For
example, a Java compiler implements
+
with the
iadd
JVM instruction if the types of
a
and
b
are
int
. The addition operator is compiled to a method call because the JVM
iadd
instruction requires the operand types to be statically known.
A compiler for a dynamically-typed language must defer the choice until runtime. The
statement
a + b
is compiled as the method call
+(a, b)
, where
+
is the method
name. A method named
+
is permitted in the JVM but not in the Java programming
language. If the runtime system for the dynamically-typed language is able to identify
that
a
and
b
are variables of integer type, then the runtime system would prefer to call
an implementation of
+
that is specialized for integer types rather than arbitrary object
types.
Chapter 7
The Challenge of Compiling Dynamically-Typed Languages
7-3

The challenge of compiling dynamically-typed languages is how to implement a
runtime system that can choose the most appropriate implementation of a method
or function — after the program has been compiled. Treating all variables as objects
of
Object
type would not work efficiently; the
Object
class does not contain a method
named
+
.
In Java SE 7 and later, the
invokedynamic
instruction enables the runtime system
to customize the linkage between a call site and a method implementation. In this
example, the
invokedynamic
call site is
+
. An
invokedynamic
call site is linked to
a method by means of a bootstrap method, which is a method specified by the
compiler for the dynamically-typed language that is called once by the JVM to link the
site. Assuming the compiler emitted an
invokedynamic
instruction that invokes
+
, and
assuming that the runtime system knows about the method
adder(Integer,Integer)
,
the runtime can link the
invokedynamic
call site to the
adder
method as follows:
IntegerOps.java
class IntegerOps {
public static Integer adder(Integer x, Integer y) {
return x + y;
}
}
Example.java
import java.util.*;
import java.lang.invoke.*;
import static java.lang.invoke.MethodType.*;
import static java.lang.invoke.MethodHandles.*;
class Example {
public static CallSite mybsm(
MethodHandles.Lookup callerClass, String dynMethodName, MethodType
dynMethodType)
throws Throwable {
MethodHandle mh =
callerClass.findStatic(
Example.class,
"IntegerOps.adder",
MethodType.methodType(Integer.class, Integer.class,
Integer.class));
if (!dynMethodType.equals(mh.type())) {
mh = mh.asType(dynMethodType);
}
return new ConstantCallSite(mh);
}
}
Chapter 7
The Challenge of Compiling Dynamically-Typed Languages
7-4

In this example, the
IntegerOps
class belongs to the library that accompanies runtime
system for the dynamically-typed language.
The
Example.mybsm
method is a bootstrap method that links the
invokedynamic
call
site to the
adder
method.
The
callerClass
object is a
lookup
object, which is a factory for creating method
handles.
The
MethodHandles.Lookup.findStatic
method (called from the
callerClass
lookup
object) creates a static method handle for the method
adder
.
Note: This bootstrap method links an
invokedynamic
call site to only the code
that is defined in the
adder
method. It assumes that the arguments given to the
invokedynamic
call site are
Integer
objects. A bootstrap method requires additional
code to properly link
invokedynamic
call sites to the appropriate code to execute if the
parameters of the bootstrap method (in this example,
callerClass
,
dynMethodName
,
and
dynMethodType
) vary.
The
java.lang.invoke.MethodHandles
class and
java.lang.invoke.MethodHandle
class contain various methods that create method handles based on existing method
handles. This example calls the
asType
method if the method type of the
mh
method
handle does not match the method type specified by the
dynMethodType
parameter.
This enables the bootstrap method to link
invokedynamic
call sites to Java methods
whose method types don’t exactly match.
The
ConstantCallSite
instance returned by the bootstrap method represents a call
site to be associated with a distinct
invokedynamic
instruction. The target for a
ConstantCallSite
instance is permanent and can never be changed. In this case,
one Java method,
adder
, is a candidate for executing the call site. This method does
not have to be a Java method. Instead, if several such methods are available to the
runtime system, each handling different argument types, the
mybsm
bootstrap method
could dynamically select the correct method based on the
dynMethodType
argument.
The invokedynamic Instruction
You can use the
invokedynamic
instruction in implementations of compilers and
runtime systems for dynamically typed languages on the JVM. The
invokedynamic
instruction enables the language implementer to define custom linkage. This contrasts
with other JVM instructions such as
invokevirtual
, in which linkage behavior specific
to Java classes and interfaces is hard-wired by the JVM.
Each instance of an
invokedynamic
instruction is called a dynamic call site. When an
instance of the dynamic call site is created, it is in an unlinked state, with no method
specified for the call site to invoke. The dynamic call site is linked to a method by
means of a bootstrap method. A dynamic call site's bootstrap method is a method
specified by the compiler for the dynamically-typed language. The method is called
once by the JVM to link the site. The object returned from the bootstrap method
permanently determines the call site's activity.
The
invokedynamic
instruction contains a constant pool index (in the same
format as for the other
invoke
instructions). This constant pool index references
a
CONSTANT_InvokeDynamic
entry. This entry specifies the bootstrap method (a
CONSTANT_MethodHandle
entry), the name of the dynamically-linked method, and the
argument types and return type of the call to the dynamically-linked method.
Chapter 7
The invokedynamic Instruction
7-5

In the following example, the runtime system links the dynamic call site specified by
the
invokedynamic
instruction (which is
+
, the addition operator) to the
IntegerOps.adder
method by using the
Example.mybsm
bootstrap method. The
adder
method and
mybsm
method are defined in The Challenge of Compiling Dynamically Typed Languages (line
breaks have been added for clarity):
invokedynamic InvokeDynamic
REF_invokeStatic:
Example.mybsm:
"(Ljava/lang/invoke/MethodHandles/Lookup;
Ljava/lang/String;
Ljava/lang/invoke/MethodType;)
Ljava/lang/invoke/CallSite;":
+:
"(Ljava/lang/Integer;
Ljava/lang/Integer;)
Ljava/lang/Integer;";
Note:
The bytecode examples use the syntax of the ASM Java bytecode
manipulation and analysis framework.
Invoking a dynamically-linked method with the
invokedynamic
instruction involves the
following steps:
1. Defining the Bootstrap Method
2. Specifying Constant Pool Entries
3. Using the
invokedynamic
Instruction
Defining the Bootstrap Method
At runtime, the first time the JVM encounters an
invokedynamic
instruction, it calls
the bootstrap method. This method links the name that the
invokedynamic
instruction
specifies with the code to execute the target method, which is referenced by a method
handle. The next time the JVM executes the same
invokedynamic
instruction, it does
not call the bootstrap method; it automatically calls the linked method handle.
The bootstrap method's return type must be
java.lang.invoke.CallSite
. The
CallSite
object represents the linked state of the
invokedynamic
instruction and the
method handle to which it is linked.
The bootstrap method takes three or more of the following parameters:
•
MethodHandles.Lookup
object: A factory for creating method handles in the
context of the
invokedynamic
instruction.
•
String
object: The method name mentioned in the dynamic call site.
•
MethodType
object: The resolved type signature of the dynamic call site.
Chapter 7
The invokedynamic Instruction
7-6

• One or more additional static arguments to the
invokedynamic
instruction:
Optional arguments, drawn from the constant pool, are intended to help language
implementers safely and compactly encode additional metadata useful to the
bootstrap method. In principle, the name and extra arguments are redundant
because each call site could be given its own unique bootstrap method. However,
such a practice is likely to produce large class files and constant pools
See The Challenge of Compiling Dynamically Typed Languages for an example of a
bootstrap method.
Specifying Constant Pool Entries
The
invokedynamic
instruction contains a reference to an entry in the constant pool
with the
CONSTANT_InvokeDynamic
tag. This entry contains references to other entries
in the constant pool and references to attributes. See java.lang.invoke package
documentation and The Java Virtual Machine Specification.
Example Constant Pool
The following example shows an excerpt from the constant pool for the class
Example
,
which contains the bootstrap method
Example.mybsm
that links the method
+
with the
Java method
adder
:
class #159; // #47
Utf8 "adder"; // #83
Utf8 "(Ljava/lang/Integer;Ljava/lang/Integer;)Ljava/lang/
Integer;"; // #84
Utf8 "mybsm"; // #87
Utf8 "(Ljava/lang/invoke/MethodHandles/Lookup;Ljava/lang/
String;Ljava/lang/invoke/MethodType;)
java/lang/invoke/CallSite;"; // #88
Utf8 "Example"; // #159
Utf8 "+"; // #166
// ...
NameAndType #83 #84; // #228
Method #47 #228; // #229
MethodHandle 6b #229; // #230
NameAndType #87 #88; // #231
Method #47 #231; // #232
MethodHandle 6b #232; // #233
NameAndType #166 #84; // #234
Utf8 "BootstrapMethods"; // #235
InvokeDynamic 0s #234; // #236
The constant pool entry for the
invokedynamic
instruction in this example contains the
following values:
•
CONSTANT_InvokeDynamic
tag
• Unsigned short of value
0
• Constant pool index
#234
.
Chapter 7
The invokedynamic Instruction
7-7

The value,
0
, refers to the first bootstrap method specifier in the array of specifiers that
are stored in the
BootstrapMethods
attribute. Bootstrap method specifiers are not in
the constant pool table. They are contained in this separate array of specifiers. Each
bootstrap method specifier contains an index to a
CONSTANT_MethodHandle
constant
pool entry, which is the bootstrap method itself.
The following example shows an excerpt from the same constant pool that shows the
BootstrapMethods
attribute, which contains the array of bootstrap method specifiers:
[3] { // Attributes
// ...
Attr(#235, 6) { // BootstrapMethods at 0x0F63
[1] { // bootstrap_methods
{ // bootstrap_method
#233; // bootstrap_method_ref
[0] { // bootstrap_arguments
} // bootstrap_arguments
} // bootstrap_method
}
} // end BootstrapMethods
} // Attributes
The constant pool entry for the bootstrap method
mybsm
method handle contains the
following values:
•
CONSTANT_MethodHandle
tag
• Unsigned byte of value
6
• Constant pool index
#232
.
The value,
6
, is the
REF_invokeStatic
subtag. See, Using the invokedynamic
Instruction, for more information about this subtag.
Using the invokedynamic Instruction
The following example shows how the bytecode uses the
invokedynamic
instruction
to call the
mybsm
bootstrap method, which links the dynamic call site (
+
, the addition
operator) to the
adder
method. This example uses the
+
method to add the numbers
40
and
2
(line breaks have been added for clarity):
bipush 40;
invokestatic Method java/lang/Integer.valueOf:"(I)Ljava/lang/
Integer;";
iconst_2;
invokestatic Method java/lang/Integer.valueOf:"(I)Ljava/lang/
Integer;";
invokedynamic InvokeDynamic
REF_invokeStatic:
Example.mybsm:
"(Ljava/lang/invoke/MethodHandles/Lookup;
Chapter 7
The invokedynamic Instruction
7-8

Ljava/lang/String;
Ljava/lang/invoke/MethodType;)
Ljava/lang/invoke/CallSite;":
+:
"(Ljava/lang/Integer;
Ljava/lang/Integer;)
Ljava/lang/Integer;";
The first four instructions put the integers
40
and
2
in the stack and boxes them in the
java.lang.Integer
wrapper type. The fifth instruction invokes a dynamic method. This
instruction refers to a constant pool entry with a
CONSTANT_InvokeDynamic
tag:
REF_invokeStatic:
Example.mybsm:
"(Ljava/lang/invoke/MethodHandles/Lookup;
Ljava/lang/String;
Ljava/lang/invoke/MethodType;)
Ljava/lang/invoke/CallSite;":
+:
"(Ljava/lang/Integer;
Ljava/lang/Integer;)
Ljava/lang/Integer;";
Four bytes follow the
CONSTANT_InvokeDynamic
tag in this entry.
• The first two bytes form a reference to a
CONSTANT_MethodHandle
entry that
references a bootstrap method specifier:
REF_invokeStatic:
Example.mybsm:
"(Ljava/lang/invoke/MethodHandles/Lookup;
Ljava/lang/String;
Ljava/lang/invoke/MethodType;)
Ljava/lang/invoke/CallSite;"
This reference to a bootstrap method specifier is not in the constant pool
table. It is contained in a separate array defined by a class file attribute
named
BootstrapMethods
. The bootstrap method specifier contains an index to a
CONSTANT_MethodHandle
constant pool entry, which is the bootstrap method itself.
Three bytes follow this
CONSTANT_MethodHandle
constant pool entry:
– The first byte is the
REF_invokeStatic
subtag. This means that this bootstrap
method will create a method handle for a static method; note that this
bootstrap method is linking the dynamic call site with the static Java
adder
method.
– The next two bytes form a
CONSTANT_Methodref
entry that represents the
method for which the method handle is to be created:
Example.mybsm:
Chapter 7
The invokedynamic Instruction
7-9

"(Ljava/lang/invoke/MethodHandles/Lookup;
Ljava/lang/String;
Ljava/lang/invoke/MethodType;)
Ljava/lang/invoke/CallSite;"
In this example, the fully qualified name of the bootstrap method is
Example.mybsm
. The argument types are
MethodHandles.Lookup
,
String
, and
MethodType
. The return type is
CallSite
.
• The next two bytes form a reference to a
CONSTANT_NameAndType
entry:
+:
"(Ljava/lang/Integer;
Ljava/lang/Integer;)
Ljava/lang/Integer;"
This constant pool entry specifies the method name (
+
), the argument types (two
Integer
instances), and return type of the dynamic call site (
Integer
).
In this example, the dynamic call site is presented with boxed integer values,
which exactly match the type of the eventual target, the
adder
method. In practice,
the argument and return types don’t need to exactly match. For example, the
invokedynamic
instruction could pass either or both of its operands on the JVM stack
as primitive
int
values. Either or both operands could be untyped
Object
values.
The
invokedynamic
instruction could receive its result as a primitive
int
value, or an
untyped
Object
value. In any case, the
dynMethodType
argument to
mybsm
accurately
describes the method type that is required by the
invokedynamic
instruction.
The
adder
method could be given primitive or untyped arguments or return values.
The bootstrap method is responsible for making up any difference between the
dynMethodType
and the type of the
adder
method. As shown in the code, this is easily
done with an
asType
call on the target method.
Chapter 7
The invokedynamic Instruction
7-10

8
Signal Chaining
Signal chaining enables you to write applications that need to install their own signal
handlers. This facility is available on Linux and macOS.
The signal chaining facility has the following features:
• Support for preinstalled signal handlers when you create Oracle’s HotSpot Virtual
Machine.
When the HotSpot VM is created, the signal handlers for signals that are used
by the HotSpot VM are saved. During execution, when any of these signals are
raised and are not to be targeted at the HotSpot VM, the preinstalled handlers
are invoked. In other words, preinstalled signal handlers are chained behind the
HotSpot VM handlers for these signals.
• Support for the signal handlers that are installed after you create the HotSpot VM,
either inside the Java Native Interface code or from another native thread.
Your application can link and load the
libjsig.so
shared library before the
libc/
libthread/libpthread
library. This library ensures that calls such as
signal()
,
sigset()
, and
sigaction()
are intercepted and don’t replace the signal handlers
that are used by the HotSpot VM, if the handlers conflict with the signal handlers
that are already installed by HotSpot VM. Instead, these calls save the new signal
handlers. The new signal handlers are chained behind the HotSpot VM signal
handlers for the signals. During execution, when any of these signals are raised
and are not targeted at the HotSpot VM, the preinstalled handlers are invoked.
If support for signal handler installation after the creation of the VM is not required,
then the
libjsig.so
shared library is not needed.
To enable signal chaining, perform one of the following procedures to use the
libjsig.so
shared library:
– Link the
libjsig.so
shared library with the application that creates or embeds
the HotSpot VM:
cc -L libjvm.so-directory -ljsig -ljvm java_application.c
– Use the
LD_PRELOAD
environment variable:
* Korn shell (ksh):
export LD_PRELOAD=libjvm.so-directory/libjsig.so;
java_application
* C shell (csh):
setenv LD_PRELOAD libjvm.so-directory/libjsig.so;
java_application
8-1

The interposed
signal()
,
sigset()
, and
sigaction()
calls return the saved
signal handlers, not the signal handlers installed by the HotSpot VM and are seen
by the operating system.
Note:
The
SIGQUIT
,
SIGTERM
,
SIGINT
, and
SIGHUP
signals cannot be chained. If the
application must handle these signals, then consider using the
—Xrs
option.
Enable Signal Chaining in macOS
To enable signal chaining in macOS, set the following environment variables:
•
DYLD_INSERT_LIBRARIES
: Preloads the specified libraries instead of the
LD_PRELOAD
environment variable available on Linux.
•
DYLD_FORCE_FLAT_NAMESPACE
: Enables functions in the
libjsig
library and
replaces the OS implementations, because of macOS’s two-level namespace (a
symbol's fully qualified name includes its library). To enable this feature, set this
environment variable to any value.
The following command enables signal chaining by preloading the
libjsig
library:
$ DYLD_FORCE_FLAT_NAMESPACE=0 DYLD_INSERT_LIBRARIES="JAVA_HOME/lib/
libjsig.dylib" java MySpiffyJavaApp
Note:
The library file name on macOS is
libjsig.dylib
not
libjsig.so
as it is on
Linux.
Chapter 8
8-2

9
Native Memory Tracking
This chapter describes the Native Memory Tracking (NMT) feature. NMT is a Java
Hotspot VM feature that tracks internal memory usage for a HotSpot VM. You can
access NMT data by using the
jcmd
utility. NMT does not track memory allocations for
third-party native code and Oracle Java Development Kit (JDK) class libraries. NMT
does not include NMT
MBean
in HotSpot for Java Mission Control (JMC).
Topics:
• Key Features
• Using Native Memory Tracking
– Enabling NMT
– Accessing NMT Data using jcmd
• Obtaining NMT Data at VM Exit
Key Features
When you use Native Memory Tracking with jcmd, you can track Java Virtual Machine
(JVM) or HotSpot VM memory usage at different levels. NMT tracks only the memory
that the JVM or HotSpot VM uses, not the user's native memory. NMT doesn't give
complete information for the memory used by the class data sharing (CDS) archive.
NMT for HotSpot VM is turned off by default. You can turn on NMT by using the JVM
command-line option. See java in the Java Development Kit Tool Specifications for
information about advanced runtime options.
You can access NMT using the
jcmd
utility. See Use jcmd to Access NMT Data. You
can stop NMT by using the
jcmd
utility, but you can't start or restart NMT by using the
jcmd
utilty.
NMT supports the following features:
• Generate summary and detail reports.
• Establish an early baseline for later comparison.
• Request a memory usage report at JVM exit with the JVM command-line option.
See NMT at VM exit.
Using Native Memory Tracking
You must enable NMT and then use the
jcmd
utility to access the NMT data.
Enabling NMT
To enable NMT, use the following command-line options:
9-1

-XX:NativeMemoryTracking=[off | summary | detail]
Note:
Enabling NMT causes a 5% -10% performance overhead.
The following table describes the NMT command-line usage options:
Table 9-1 NMT Usage Options
NMT Options Description
off
NMT is turned
off
by default.
summary
Collect only memory usage aggregated by subsystem.
detail
Collect the memory usage by individual call sites.
Accessing NMT Data using jcmd
Use
jcmd
to dump the data that is collected and optionally compare the data to the last
baseline.
jcmd <pid> VM.native_memory [summary | detail | baseline | summary.diff |
detail.diff | shutdown] [scale= KB | MB | GB]
Table 9-2 jcmd NMT Options
jcmd NMT Option Description
summary
Print a summary, aggregated by category.
detail
• Print memory usage, aggregated by category
• Print virtual memory map
• Print memory usage, aggregated by call site
baseline
Create a new memory usage snapshot for comparison.
summary.diff
Print a new summary report against the last baseline.
detail.diff
Print a new detail report against the last baseline.
shutdown
Stop NMT.
Obtaining NMT Data at VM Exit
To obtain data for the last memory usage at VM exit, when Native Memory Tracking is
enabled, use the following VM diagnostic command-line options. The level of detail is
based on tracking level.
-XX:+UnlockDiagnosticVMOptions -XX:+PrintNMTStatistics
See Native Memory Tracking in the Java Platform, Standard Edition Troubleshooting
Guide for information about how to monitor VM internal memory allocations and
diagnose VM memory leaks.
Chapter 9
Obtaining NMT Data at VM Exit
9-2

10
DTrace Probes in HotSpot VM
This chapter describes DTrace support in Oracle’s HotSpot VM. The hotspot and
hotspot_jni providers let you access probes that you can use to monitor the Java
application that is running together with the internal state and activities of the Java
Virtual Machine (JVM). All of the probes are USDT probes and you can access them
by using the process-id of the JVM process.
Topics:
• Using the hotspot Provider
– VM Lifecycle Probes
– Thread Lifecycle Probes
– Classloading Probes
– Garbage Collection Probes
– Method Compilation Probes
– Monitor Probes
– Application Tracking Probes
• Using the hotspot_jni Provider
• Sample DTrace Probes
Using the hotspot Provider
The hotspot provider lets you access probes that you can use to track the lifespan
of the VM, thread start and stop events, garbage collector (GC) and memory
pool statistics, method compilations, and monitor activity. A startup flag can enable
additional probes that you can use to monitor the running Java program, such as
object allocations and method enter and return probes. The hotspot probes originate in
the VM library (libjvm.so), so they are provided from programs that embed the VM.
Many of the probes in the provider have arguments for providing further details on the
state of the VM. Many of these arguments are opaque IDs which can be used to link
probe firings to each other. However, strings and other data are also provided. When
string values are provided, they are always present as a pair: a pointer to unterminated
modified UTF-8 data (see the JVM Specification) , and a length value which indicates
the extent of that data. The string data is not guaranteed to be terminated by a NUL
character, and it is necessary to use the length-terminated
copyinstr()
intrinsic to
read the string data. This is true even when none of the characters are outside the
ASCII range.
VM Lifecycle Probes
The following probes are available for tracking VM lifecycle activities. None have any
arguments.
10-1

Table 10-1 VM Lifecycle Probes
Probe Description
vm-init-begin
Probe that starts when the VM initialization begins
vm-init-end
Probe that starts when the VM initialization finishes, and
the VM is ready to start running application code
vm-shutdown
Probe that starts as the VM is shuts down due to
program termination or an error
Thread Lifecycle Probes
The following probes are available for tracking thread start and stop events.
Probe Description
thread-start
Probe that starts when a thread starts.
thread-stop
Probe that starts when the thread has completed.
The following argument are available for the thread lifecycle probes:
Probe Arguments Description
args[0]
A pointer to UTF-8 string data that contains the thread
name.
args[1]
The length of the thread name data (in bytes).
args[2]
The Java thread ID. This value matches other HotSpot
VM probes that contain a thread argument.
args[3]
The native or OS thread ID. This ID is assigned by the
host operating system.
args[4]
A boolean value that indicates whether this thread is a
daemon or not. A value of 0 indicates a non-daemon
thread.
Classloading Probes
The following probes are available for tracking class loading and unloading activity.
Probe Description
class-loaded
Probe that fires when a class is loaded
class-unloaded
Probe that fires when a class is unloaded from the
system
The following arguments are available for the
classloading
probes:
Probe Arguments
Description
args[0]
A pointer to UTF-8 string data that contains the name of
the class that is loaded
Chapter 10
Using the hotspot Provider
10-2
Probe Arguments Description
args[1]
The length of the class name data (in bytes)
args[2]
The class loader ID, which is a unique identifier for a
class loader in the VM. (This is the class loader that
loaded the class.)
args[3]
A boolean value that indicates whether the class is a
shared class (if the class was loaded from the shared
archive)
Garbage Collection Probes
Probes are available that you can use to measure the duration of a system-wide
garbage collection cycle (for those garbage collectors that have a defined begin and
end). Each memory pool is tracked independently. The probes for individual pools
pass the memory manager's name, the pool name, and pool usage information at both
the beginning and ending of pool collection.
The following probes are available for garbage collecting activities:
Probe Description
gc-begin
Probe that starts when a system-wide collection starts.
The one argument available for this probe, (
arg[0]
), is
a boolean value that indicates whether to perform a Full
GC.
gc-end
Probe that starts when a system-wide collection is
completed. No arguments.
mem-pool-gc-begin
Probe that starts when an individual memory pool is
collected.
mem-pool-gc-end
Probe that starts after an individual memory pool is
collected.
The following arguments are available for the memory pool probes:
Probe Arguments Description
args[0]
A pointer to the UTF-8 string data that contains the
name of the manager that manages this memory pool.
args[1]
The length of the manager name data (in bytes).
args[2]
A pointer to the UTF-8 string data that contains the
name of the memory pool.
args[3]
The length of the memory pool name data (in bytes).
args[4]
The initial size of the memory pool (in bytes).
args[5]
The amount of memory in use in the memory pool (in
bytes).
args[6]
The number of committed pages in the memory pool.
args[7]
The maximum size of the memory pool.
Chapter 10
Using the hotspot Provider
10-3

Method Compilation Probes
Probes are available to indicate which methods are being compiled and by which
compiler, and to track when the compiled methods are installed or uninstalled.
The following probes are available to mark the beginning and ending of method
compilation:
Probe Description
method-compile-begin
Probe that starts when the method compilation begins.
method-compile-end
Probe that starts when method compilation is
completed. In addition to the following arguments, the
argv[8]
argument is a boolean value that indicates
whether the compilation was successful.
The following arguments are available for the method compilation probes:
Probe Arguments Description
args[0]
A pointer to UTF-8 string data that contains the name of
the compiler that is compiling this method.
args[1]
The length of the compiler name data (in bytes).
args[2]
A pointer to UTF-8 string data that contains the name of
the class of the method being compiled.
args[3]
The length of the class name data (in bytes).
args[4]
A pointer to UTF-8 string data that contains the name of
the method being compiled.
args[5]
The length of the method name data (in bytes).
args[6]
A pointer to UTF-8 string data that contains the
signature of the method being compiled.
args[7]
The length of the signature data (in bytes).
The following probes are available when compiled methods are installed for execution
or uninstalled:
Probe Description
compiled-method-load
Probe that starts when a compiled method is installed.
The additional argument,
argv[6]
contains a pointer to
the compiled code, and the
argv[7]
is the size of the
compiled code.
compiled-method-unload
Probe that starts when a compiled method is uninstalled.
The following arguments are available for the compiled method loading probe:
Probe Arguments
Description
args[0]
A pointer to UTF-8 string data that contains the name of
the class of the method being installed.
args[1]
The length of the class name data (in bytes).
Chapter 10
Using the hotspot Provider
10-4

Probe Arguments Description
args[2]
A pointer to UTF-8 string data that contains the name of
the method being installed.
args[3]
The length of the method name data (in bytes).
args[4]
A pointer to UTF-8 string data that contains the
signature of the method being installed.
args[5]
The length of the signature data (in bytes).
Monitor Probes
When your Java application runs, threads enter and exit monitors, wait on monitors,
and perform notifications. Probes are available for all wait and notification events, and
for contended monitor entry and exit events.
A contended monitor entry occurs when a thread attempts to enter a monitor while
another thread is in the monitor. A contended monitor exit event occurs when a
thread leaves a monitor while other threads are waiting to enter to the monitor. The
contended monitor entry and contended monitor exit events might not match each
other in relation to the thread that encounters these events, athough a contended exit
from one thread is expected to match up to a contended enter on another thread (the
thread waiting to enter the monitor).
Monitor events provide the thread ID, a monitor ID, and the type of the class of the
object as arguments. The thread ID and the class type can map back to the Java
program, while the monitor ID can provide matching information between probe firings.
The existence of these probes in the VM degrades performance and they start only
when the
-XX:+ExtendedDTraceProbes
flag is set on the Java command line. This flag
is turned on and off dynamically at runtime by using the
jinfo
utility.
If the flag is off, the monitor probes are present in the probe listing that is obtainable
from Dtrace, but the probes remain dormant and don’t start. Removal of this restriction
is planned for future releases of the VM, and these probes will be enabled with no
impact to performance.
The following probes are available for monitoring events:
Probe Description
monitor-contended-enter
Probe that starts when a thread attempts to enter a
contended monitor
monitor-contended-entered
Probe that starts when a thread successfully enters the
contended monitor
monitor-contended-exit
Probe that starts when a thread leaves a monitor and
other threads are waiting to enter
monitor-wait
Probe that starts when a thread begins a wait on a
monitor by using the
Object.wait()
. The additional
argument,
args[4]
is a long value that indicates the
timeout being used.
monitor-waited
Probe that starts when a thread completes an
Object.wait()
action.
Chapter 10
Using the hotspot Provider
10-5

Probe Description
monitor-notify
Probe that starts when a thread calls
Object.notify()
to notify waiters on a monitor.
monitor-notifyAll
Probe that starts when a thread calls
Object.notifyAll()
to notify waiters on a monitor.
The following arguments are available for the monitor:
Probe Arguments Description
args[0]
The Java thread identifier for the thread performing the
monitor operation.
args[1]
A unique, but opaque identifier for the specific monitor
that the action is performed upon.
args[2]
A pointer to UTF-8 string data which contains the class
name of the object being acted upon.
args[3]
The length of the class name data (in bytes).
Application Tracking Probes
You can use probes to allow fine-grained examination of Java thread execution.
Application tracking probes start when a method is entered or returned from, or when
a Java object has been allocated.
The existence of these probes in the VM degrades performance and they start only
when the VM has the
ExtendedDTraceProbes
flag enabled. By default, the probes are
present in any listing of the probes in the VM, but are dormant without the appropriate
flag. Removal of this restriction is planned in future releases of the VM, and these
probes will be enabled no impact to performance.
The following probes are available for the method entry and exit:
Probe Description
method-entry
Probe that starts when a method is being entered.
method-return
Probe that starts when a method returns, either normally
or due to an exception.
The following arguments are available for the method entry and exit:
Probe Arguments Description
args[0]
The Java thread ID of the thread that is entering or
leaving the method.
args[1]
A pointer to UTF-8 string data that contains the name of
the class of the method.
args[2]
The length of the class name data (in bytes).
args[3]
A pointer to UTF-8 string data that contains the name of
the method.
args[4]
The length of the method name data (in bytes).
Chapter 10
Using the hotspot Provider
10-6

Probe Arguments Description
args[5]
A pointer to UTF-8 string data that contains the
signature of the method.
args[6]
The length of the signature data (in bytes).
The following probe is available for the object allocation:
Probe Description
object-alloc
Probe that starts when any object is allocated, provided
that the
ExtendedDTraceProbes
flag is enabled.
The following arguments are available for the object allocation probe:
Probe Arguments Description
args[0]
The Java thread ID of the thread that is allocating the
object.
args[1]
A pointer to UTF-8 string data that contains the class
name of the object being allocated.
args[2]
The length of the class name data (in bytes).
args[3]
The size of the object being allocated.
Using the hotspot_jni Provider
In order to call from native code to Java code, due to embedding of the VM in an
application or execution of native code within a Java application, the native code must
make a call through the Java Native Interface (JNI). The JNI provides a number of
methods for invoking Java code and examining the state of the VM. DTrace probes are
provided at the entry point and return point for each of these methods. The probes are
provided by the hotspot_jni provider. The name of the probe is the name of the JNI
method, appended with
-entry
for entry probes, and
-return
for return probes. The
arguments available at each entry probe are the arguments that were provided to the
function, with the exception of the
Invoke*
methods, which omit the arguments that
are passed to the Java method. The return probes have the return value of the method
as an argument (if available).
Sample DTrace Probes
provider hotspot {
probe vm-init-begin();
probe vm-init-end();
probe vm-shutdown();
probe class-loaded(
char* class_name, uintptr_t class_name_len, uintptr_t
class_loader_id, bool is_shared);
probe class-unloaded(
char* class_name, uintptr_t class_name_len, uintptr_t
Chapter 10
Using the hotspot_jni Provider
10-7

class_loader_id, bool is_shared);
probe gc-begin(bool is_full);
probe gc-end();
probe mem-pool-gc-begin(
char* mgr_name, uintptr_t mgr_name_len, char* pool_name,
uintptr_t pool_name_len,
uintptr_t initial_size, uintptr_t used, uintptr_t committed,
uintptr_t max_size);
probe mem-pool-gc-end(
char* mgr_name, uintptr_t mgr_name_len, char* pool_name,
uintptr_t pool_name_len,
uintptr_t initial_size, uintptr_t used, uintptr_t committed,
uintptr_t max_size);
probe thread-start(
char* thread_name, uintptr_t thread_name_length,
uintptr_t java_thread_id, uintptr_t native_thread_id, bool
is_daemon);
probe thread-stop(
char* thread_name, uintptr_t thread_name_length,
uintptr_t java_thread_id, uintptr_t native_thread_id, bool
is_daemon);
probe method-compile-begin(
char* class_name, uintptr_t class_name_len,
char* method_name, uintptr_t method_name_len,
char* signature, uintptr_t signature_len);
probe method-compile-end(
char* class_name, uintptr_t class_name_len,
char* method_name, uintptr_t method_name_len,
char* signature, uintptr_t signature_len,
bool is_success);
probe compiled-method-load(
char* class_name, uintptr_t class_name_len,
char* method_name, uintptr_t method_name_len,
char* signature, uintptr_t signature_len,
void* code, uintptr_t code_size);
probe compiled-method-unload(
char* class_name, uintptr_t class_name_len,
char* method_name, uintptr_t method_name_len,
char* signature, uintptr_t signature_len);
probe monitor-contended-enter(
uintptr_t java_thread_id, uintptr_t monitor_id,
char* class_name, uintptr_t class_name_len);
probe monitor-contended-entered(
uintptr_t java_thread_id, uintptr_t monitor_id,
char* class_name, uintptr_t class_name_len);
probe monitor-contended-exit(
uintptr_t java_thread_id, uintptr_t monitor_id,
char* class_name, uintptr_t class_name_len);
probe monitor-wait(
uintptr_t java_thread_id, uintptr_t monitor_id,
char* class_name, uintptr_t class_name_len,
uintptr_t timeout);
probe monitor-waited(
uintptr_t java_thread_id, uintptr_t monitor_id,
char* class_name, uintptr_t class_name_len);
Chapter 10
Sample DTrace Probes
10-8

probe monitor-notify(
uintptr_t java_thread_id, uintptr_t monitor_id,
char* class_name, uintptr_t class_name_len);
probe monitor-notifyAll(
uintptr_t java_thread_id, uintptr_t monitor_id,
char* class_name, uintptr_t class_name_len);
probe method-entry(
uintptr_t java_thread_id, char* class_name, uintptr_t
class_name_len,
char* method_name, uintptr_t method_name_len,
char* signature, uintptr_t signature_len);
probe method-return(
uintptr_t java_thread_id, char* class_name, uintptr_t
class_name_len,
char* method_name, uintptr_t method_name_len,
char* signature, uintptr_t signature_len);
probe object-alloc(
uintptr_t java_thread_id, char* class_name, uintptr_t
class_name_len,
uintptr_t size);
};
provider hotspot_jni {
probe AllocObject-entry(void*, void*);
probe AllocObject-return(void*);
probe AttachCurrentThreadAsDaemon-entry(void*, void**, void*);
probe AttachCurrentThreadAsDaemon-return(uint32_t);
probe AttachCurrentThread-entry(void*, void**, void*);
probe AttachCurrentThread-return(uint32_t);
probe CallBooleanMethodA-entry(void*, void*, uintptr_t);
probe CallBooleanMethodA-return(uintptr_t);
probe CallBooleanMethod-entry(void*, void*, uintptr_t);
probe CallBooleanMethod-return(uintptr_t);
probe CallBooleanMethodV-entry(void*, void*, uintptr_t);
probe CallBooleanMethodV-return(uintptr_t);
probe CallByteMethodA-entry(void*, void*, uintptr_t);
probe CallByteMethodA-return(char);
probe CallByteMethod-entry(void*, void*, uintptr_t);
probe CallByteMethod-return(char);
probe CallByteMethodV-entry(void*, void*, uintptr_t);
probe CallByteMethodV-return(char);
probe CallCharMethodA-entry(void*, void*, uintptr_t);
probe CallCharMethodA-return(uint16_t);
probe CallCharMethod-entry(void*, void*, uintptr_t);
probe CallCharMethod-return(uint16_t);
probe CallCharMethodV-entry(void*, void*, uintptr_t);
probe CallCharMethodV-return(uint16_t);
probe CallDoubleMethodA-entry(void*, void*, uintptr_t);
probe CallDoubleMethodA-return(double);
probe CallDoubleMethod-entry(void*, void*, uintptr_t);
probe CallDoubleMethod-return(double);
probe CallDoubleMethodV-entry(void*, void*, uintptr_t);
probe CallDoubleMethodV-return(double);
probe CallFloatMethodA-entry(void*, void*, uintptr_t);
Chapter 10
Sample DTrace Probes
10-9

probe CallFloatMethodA-return(float);
probe CallFloatMethod-entry(void*, void*, uintptr_t);
probe CallFloatMethod-return(float);
probe CallFloatMethodV-entry(void*, void*, uintptr_t);
probe CallFloatMethodV-return(float);
probe CallIntMethodA-entry(void*, void*, uintptr_t);
probe CallIntMethodA-return(uint32_t);
probe CallIntMethod-entry(void*, void*, uintptr_t);
probe CallIntMethod-return(uint32_t);
probe CallIntMethodV-entry(void*, void*, uintptr_t);
probe CallIntMethodV-return(uint32_t);
probe CallLongMethodA-entry(void*, void*, uintptr_t);
probe CallLongMethodA-return(uintptr_t);
probe CallLongMethod-entry(void*, void*, uintptr_t);
probe CallLongMethod-return(uintptr_t);
probe CallLongMethodV-entry(void*, void*, uintptr_t);
probe CallLongMethodV-return(uintptr_t);
probe CallNonvirtualBooleanMethodA-entry(void*, void*, void*,
uintptr_t);
probe CallNonvirtualBooleanMethodA-return(uintptr_t);
probe CallNonvirtualBooleanMethod-entry(void*, void*, void*,
uintptr_t);
probe CallNonvirtualBooleanMethod-return(uintptr_t);
probe CallNonvirtualBooleanMethodV-entry(void*, void*, void*,
uintptr_t);
probe CallNonvirtualBooleanMethodV-return(uintptr_t);
probe CallNonvirtualByteMethodA-entry(void*, void*, void*, uintptr_t);
probe CallNonvirtualByteMethodA-return(char);
probe CallNonvirtualByteMethod-entry(void*, void*, void*, uintptr_t);
probe CallNonvirtualByteMethod-return(char);
probe CallNonvirtualByteMethodV-entry(void*, void*, void*, uintptr_t);
probe CallNonvirtualByteMethodV-return(char);
probe CallNonvirtualCharMethodA-entry(void*, void*, void*, uintptr_t);
probe CallNonvirtualCharMethodA-return(uint16_t);
probe CallNonvirtualCharMethod-entry(void*, void*, void*, uintptr_t);
probe CallNonvirtualCharMethod-return(uint16_t);
probe CallNonvirtualCharMethodV-entry(void*, void*, void*, uintptr_t);
probe CallNonvirtualCharMethodV-return(uint16_t);
probe CallNonvirtualDoubleMethodA-entry(void*, void*, void*,
uintptr_t);
probe CallNonvirtualDoubleMethodA-return(double);
probe CallNonvirtualDoubleMethod-entry(void*, void*, void*,
uintptr_t);
probe CallNonvirtualDoubleMethod-return(double);
probe CallNonvirtualDoubleMethodV-entry(void*, void*, void*,
uintptr_t);
probe CallNonvirtualDoubleMethodV-return(double);
probe CallNonvirtualFloatMethodA-entry(void*, void*, void*,
uintptr_t);
probe CallNonvirtualFloatMethodA-return(float);
probe CallNonvirtualFloatMethod-entry(void*, void*, void*, uintptr_t);
probe CallNonvirtualFloatMethod-return(float);
probe CallNonvirtualFloatMethodV-entry(void*, void*, void*,
uintptr_t);
probe CallNonvirtualFloatMethodV-return(float);
Chapter 10
Sample DTrace Probes
10-10

probe CallNonvirtualIntMethodA-entry(void*, void*, void*, uintptr_t);
probe CallNonvirtualIntMethodA-return(uint32_t);
probe CallNonvirtualIntMethod-entry(void*, void*, void*, uintptr_t);
probe CallNonvirtualIntMethod-return(uint3t);
probe CallNonvirtualIntMethodV-entry(void*, void*, void*, uintptr_t);
probe CallNonvirtualIntMethodV-return(uint32_t);
probe CallNonvirtualLongMethodA-entry(void*, void*, void*, uintptr_t);
probe CallNonvirtualLongMethodA-return(uintptr_t);
probe CallNonvirtualLongMethod-entry(void*, void*, void*, uintptr_t);
probe CallNonvirtualLongMethod-return(uintptr_t);
probe CallNonvirtualLongMethodV-entry(void*, void*, void*, uintptr_t);
probe CallNonvirtualLongMethodV-return(uintptr_t);
probe CallNonvirtualObjectMethodA-entry(void*, void*, void*,
uintptr_t);
probe CallNonvirtualObjectMethodA-return(void*);
probe CallNonvirtualObjectMethod-entry(void*, void*, void*,
uintptr_t);
probe CallNonvirtualObjectMethod-return(void*);
probe CallNonvirtualObjectMethodV-entry(void*, void*, void*,
uintptr_t);
probe CallNonvirtualObjectMethodV-return(void*);
probe CallNonvirtualShortMethodA-entry(void*, void*, void*,
uintptr_t);
probe CallNonvirtualShortMethodA-return(uint16_t);
probe CallNonvirtualShortMethod-entry(void*, void*, void*, uintptr_t);
probe CallNonvirtualShortMethod-return(uint16_t);
probe CallNonvirtualShortMethodV-entry(void*, void*, void*,
uintptr_t);
probe CallNonvirtualShortMethodV-return(uint16_t);
probe CallNonvirtualVoidMethodA-entry(void*, void*, void*, uintptr_t);
probe CallNonvirtualVoidMethodA-return();
probe CallNonvirtualVoidMethod-entry(void*, void*, void*, uintptr_t);
probe CallNonvirtualVoidMethod-return();
probe CallNonvirtualVoidMethodV-entry(void*, void*, void*,
uintptr_t);
probe CallNonvirtualVoidMethodV-return();
probe CallObjectMethodA-entry(void*, void*, uintptr_t);
probe CallObjectMethodA-return(void*);
probe CallObjectMethod-entry(void*, void*, uintptr_t);
probe CallObjectMethod-return(void*);
probe CallObjectMethodV-entry(void*, void*, uintptr_t);
probe CallObjectMethodV-return(void*);
probe CallShortMethodA-entry(void*, void*, uintptr_t);
probe CallShortMethodA-return(uint16_t);
probe CallShortMethod-entry(void*, void*, uintptr_t);
probe CallShortMethod-return(uint16_t);
probe CallShortMethodV-entry(void*, void*, uintptr_t);
probe CallShortMethodV-return(uint16_t);
probe CallStaticBooleanMethodA-entry(void*, void*, uintptr_t);
probe CallStaticBooleanMethodA-return(uintptr_t);
probe CallStaticBooleanMethod-entry(void*, void*, uintptr_t);
probe CallStaticBooleanMethod-return(uintptr_t);
probe CallStaticBooleanMethodV-entry(void*, void*, uintptr_t);
probe CallStaticBooleanMethodV-return(uintptr_t);
probe CallStaticByteMethodA-entry(void*, void*, uintptr_t);
Chapter 10
Sample DTrace Probes
10-11

probe CallStaticByteMethodA-return(char);
probe CallStaticByteMethod-entry(void*, void*, uintptr_t);
probe CallStaticByteMethod-return(char);
probe CallStaticByteMethodV-entry(void*, void*, uintptr_t);
probe CallStaticByteMethodV-return(char);
probe CallStaticCharMethodA-entry(void*, void*, uintptr_t);
probe CallStaticCharMethodA-return(uint16_t);
probe CallStaticCharMethod-entry(void*, void*, uintptr_t);
probe CallStaticCharMethod-return(uint16_t);
probe CallStaticCharMethodV-entry(void*, void*, uintptr_t);
probe CallStaticCharMethodV-return(uint16_t);
probe CallStaticDoubleMethodA-entry(void*, void*, uintptr_t);
probe CallStaticDoubleMethodA-return(double);
probe CallStaticDoubleMethod-entry(void*, void*, uintptr_t);
probe CallStaticDoubleMethod-return(double);
probe CallStaticDoubleMethodV-entry(void*, void*, uintptr_t);
probe CallStaticDoubleMethodV-return(double);
probe CallStaticFloatMethodA-entry(void*, void*, uintptr_t);
probe CallStaticFloatMethodA-return(float);
probe CallStaticFloatMethod-entry(void*, void*, uintptr_t);
probe CallStaticFloatMethod-return(float);
probe CallStaticFloatMethodV-entry(void*, void*, uintptr_t);
probe CallStaticFloatMethodV-return(float);
probe CallStaticIntMethodA-entry(void*, void*, uintptr_t);
probe CallStaticIntMethodA-return(uint32_t);
probe CallStaticIntMethod-entry(void*, void*, uintptr_t);
probe CallStaticIntMethod-return(uint32_t);
probe CallStaticIntMethodentry(void*, void*, uintptr_t);
probe CallStaticIntMethodV-return(uint32_t);
probe CallStaticLongMethodA-entry(void*, void*, uintptr_t);
probe CallStaticLongMethodA-return(uintptr_t);
probe CallStaticLongMethod-entry(void*, void*, uintptr_t);
probe CallStaticLongMethod-return(uintptr_t);
probe CallStaticLongMethodV-entry(void*, void*, uintptr_t);
probe CallStaticLongMethodV-return(uintptr_t);
probe CallStaticObjectMethodA-entry(void*, void*, uintptr_t);
probe CallStaticObjectMethodA-return(void*);
probe CallStaticObjectMethod-entry(void*, void*, uintptr_t);
probe CallStaticObjectMethod-return(void*);
probe CallStaticObjectMethodV-entry(void*, void*, uintptr_t);
probe CallStaticObjectMethodV-return(void*);
probe CallStaticShortMethodA-entry(void*, void*, uintptr_t);
probe CallStaticShortMethodA-return(uint16_t);
probe CallStaticShortMethod-entry(void*, void*, uintptr_t);
probe CallStaticShortMethod-return(uint16_t);
probe CallStaticShortMethodV-entry(void*, void*, uintptr_t);
probe CallStaticShortMethodV-return(uint16_t);
probe CallStaticVoidMethodA-entry(void*, void*, uintptr_t);
probe CallStaticVoidMethodA-return();
probe CallStaticVoidMethod-entry(void*, void*, uintptr_t);
probe CallStaticVoidMethod-return();
probe CallStaticVoidMethodV-entry(void*, void*, uintptr_t);
probe CallStaticVoidMethodV-return();
probe CallVoidMethodA-entry(void*, void*, uintptr_t);
probe CallVoidMethodA-return();
Chapter 10
Sample DTrace Probes
10-12

probe CallVoidMethod-entry(void*, void*, uintptr_t);
probe CallVoidMethod-return();
probe CallVoidMethodV-entry(void*, void*, uintptr_t);
probe CallVoidMethodV-return();
probe CreateJavaVM-entry(void**, void**, void*);
probe CreateJavaVM-return(uint32_t);
probe DefineClass-entry(void*, const char*, void*, char, uintptr_t);
probe DefineClass-return(void*);
probe DeleteGlobalRef-entry(void*, void*);
probe DeleteGlobalRef-return();
probe DeleteLocalRef-entry(void*, void*);
probe DeleteLocalRef-return();
probe DeleteWeakGlobalRef-entry(void*, void*);
probe DeleteWeakGlobalRef-return();
probe DestroyJavaVM-entry(void*);
probe DestroyJavaVM-return(uint32_t);
probe DetachCurrentThread-entry(void*);
probe DetachCurrentThread-return(uint32_t);
probe EnsureLocalCapacity-entry(void*, uint32_t);
probe EnsureLocalCapacity-return(uint32_t);
probe ExceptionCheck-entry(void*);
probe ExceptionCheck-return(uintptr_t);
probe ExceptionClear-entry(void*);
probe ExceptionClear-return();
probe ExceptionDescribe-entry(void*);
probe ExceptionDescribe-return();
probe ExceptionOccurred-entry(void*);
probe ExceptionOccurred-return(void*);
probe FatalError-entry(void* env, const char*);
probe FindClass-entry(void*, const char*);
probe FindClass-return(void*);
probe FromReflectedField-entry(void*, void*);
probe FromReflectedField-return(uintptr_t);
probe FromReflectedMethod-entry(void*, void*);
probe FromReflectedMethod-return(uintptr_t);
probe GetArrayLength-entry(void*, void*);
probe GetArrayLength-return(uintptr_t);
probe GetBooleanArrayElements-entry(void*, void*, uintptr_t*);
probe GetBooleanArrayElements-return(uintptr_t*);
probe GetBooleanArrayRegion-entry(void*, void*, uintptr_t, uintptr_t,
uintptr_t*);
probe GetBooleanArrayRegion-return();
probe GetBooleanField-entry(void*, void*, uintptr_t);
probe GetBooleanField-return(uintptr_t);
probe GetByteArrayElements-entry(void*, void*, uintptr_t*);
probe GetByteArrayElements-return(char*);
probe GetByteArrayRegion-entry(void*, void*, uintptr_t, uintptr_t,
char*);
probe GetByteArrayRegion-return();
probe GetByteField-entry(void*, void*, uintptr_t);
probe GetByteField-return(char);
probe GetCharArrayElements-entry(void*, void*, uintptr_t*);
probe GetCharArrayElements-return(uint16_t*);
probe GetCharArrayRegion-entry(void*, void*, uintptr_t, uintptr_t,
uint16_t*);
Chapter 10
Sample DTrace Probes
10-13

probe GetCharArrayRegion-return();
probe GetCharField-entry(void*, void*, uintptr_t);
probe GetCharField-return(uint16_t);
probe GetCreatedJavaVMs-eintptr_t*);
probe GetCreatedJavaVMs-return(uintptr_t);
probe GetCreateJavaVMs-entry(void*, uintptr_t, uintptr_t*);
probe GetCreateJavaVMs-return(uint32_t);
probe GetDefaultJavaVMInitArgs-entry(void*);
probe GetDefaultJavaVMInitArgs-return(uint32_t);
probe GetDirectBufferAddress-entry(void*, void*);
probe GetDirectBufferAddress-return(void*);
probe GetDirectBufferCapacity-entry(void*, void*);
probe GetDirectBufferCapacity-return(uintptr_t);
probe GetDoubleArrayElements-entry(void*, void*, uintptr_t*);
probe GetDoubleArrayElements-return(double*);
probe GetDoubleArrayRegion-entry(void*, void*, uintptr_t, uintptr_t,
double*);
probe GetDoubleArrayRegion-return();
probe GetDoubleField-entry(void*, void*, uintptr_t);
probe GetDoubleField-return(double);
probe GetEnv-entry(void*, void*, void*);
probe GetEnv-return(uint32_t);
probe GetFieldID-entry(void*, void*, const char*, const char*);
probe GetFieldID-return(uintptr_t);
probe GetFloatArrayElements-entry(void*, void*, uintptr_t*);
probe GetFloatArrayElements-return(float*);
probe GetFloatArrayRegion-entry(void*, void*, uintptr_t, uintptr_t,
float*);
probe GetFloatArrayRegion-return();
probe GetFloatField-entry(void*, void*, uintptr_t);
probe GetFloatField-return(float);
probe GetIntArrayElements-entry(void*, void*, uintptr_t*);
probe GetIntArrayElements-return(uint32_t*);
probe GetIntArrayRegion-entry(void*, void*, uintptr_t, uintptr_t,
uint32_t*);
probe GetIntArrayRegion-return();
probe GetIntField-entry(void*, void*, uintptr_t);
probe GetIntField-return(uint32_t);
probe GetJavaVM-entry(void*, void**);
probe GetJavaVM-return(uint32_t);
probe GetLongArrayElements-entry(void*, void*, uintptr_t*);
probe GetLongArrayElements-return(uintptr_t*);
probe GetLongArrayRegion-entry(void*, void*, uintptr_t, uintptr_t,
uintptr_t*);
probe GetLongArrayRegion-return();
probe GetLongField-entry(void*, void*, uintptr_t);
probe GetLongField-return(uintptr_t);
probe GetMethodID-entry(void*, void*, const char*, const char*);
probe GetMethodID-return(uintptr_t);
probe GetObjectArrayElement-entry(void*, void*, uintptr_t);
probe GetObjectArrayElement-return(void*);
probe GetObjectClass-entry(void*, void*);
probe GetObjectClass-return(void*);
probe GetObjectField-entry(void*, void*, uintptr_t);
probe GetObjectField-return(void*);
Chapter 10
Sample DTrace Probes
10-14

probe GetObjectRefType-entry(void*, void*);
probe GetObjectRefType-return(void*);
probe GetPrimitiveArrayCritical-entry(void*, void*, uintptr_t*);
probe GetPrimitiveArrayCritical-return(void*);
probe GetShortArrayElements-entry(void*, void*, uintptr_t*);
probe GetShortArrayElements-return(uint16_t*);
probe GetShortArrayRegion-entry(void*, void*, uintptr_t, uintptr_t,
uint16_t*);
probe GetShortArrayRegion-return();
probe GetShortField-entry(void*, void*, uintptr_t);
probe GetShortField-return(uint16_t);
probe GetStaticBooleanField-entry(void*, void*, uintptr_t);
probe GetStaticBooleanField-return(uintptr_t);
probe GetStaticByteField-entry(void*, void*, uintptr_t);
probe GetStaticByteField-return(char);
probe GetStaticCharField-entry(void*, void*, uintptr_t);
probe GetStaticCharField-return(uint16_t);
probe GetStaticDoubleField-entry(void*, void*, uintptr_t);
probe GetStaticDoubleField-return(double);
probe GetStaticFieldID-entry(void*, void*, const char*, const char*);
probe GetStaticFieldID-return(uintptr_t);
probe GetStaticFloatField-entry(void*, void*, uintptr_t);
probe GetStaticFloatField-return(float);
probe GetStaticIntField-entry(void*, void*, uintptr_t);
probe GetStaticIntField-return(uint32_t);
probe GetStaticLongField-entry(void*, void*, uintptr_t);
probe GetStaticLongField-return(uintptr_t);
probe GetStaticMethodID-entry(void*, void*, const char*, const char*);
probe GetStaticMethodID-return(uintptr_t);
probe GetStaticObjectField-entry(void*, void*, uintptr_t);
probe GetStaticObjectField-return(void*);
probe GetStaticShortField-entry(void*, void*, uintptr_t);
probe GetStaticShortField-return(uint16_t);
pro GetStringChars-entry(void*, void*, uintptr_t*);
probe GetStringChars-return(const uint16_t*);
probe GetStringCritical-entry(void*, void*, uintptr_t*);
probe GetStringCritical-return(const uint16_t*);
probe GetStringLength-entry(void*, void*);
probe GetStringLength-return(uintptr_t);
probe GetStringRegion-entry(void*, void*, uintptr_t, uintptr_t,
uint16_t*);
probe GetStringRegion-return();
probe GetStringUTFChars-entry(void*, void*, uintptr_t*);
probe GetStringUTFChars-return(const char*);
probe GetStringUTFLength-entry(void*, void*);
probe GetStringUTFLength-return(uintptr_t);
probe GetStringUTFRegion-entry(void*, void*, uintptr_t, uintptr_t,
char*);
probe GetStringUTFRegion-return();
probe GetSuperclass-entry(void*, void*);
probe GetSuperclass-return(void*);
probe GetVersion-entry(void*);
probe GetVersion-return(uint32_t);
probe IsAssignableFrom-entry(void*, void*, void*);
probe IsAssignableFrom-return(uintptr_t);
Chapter 10
Sample DTrace Probes
10-15

probe IsInstanceOf-entry(void*, void*, void*);
probe IsInstanceOf-return(uintptr_t);
probe IsSameObject-entry(void*, void*, void*);
probe IsSameObject-return(uintptr_t);
probe MonitorEnter-entry(void*, void*);
probe MonitorEnter-return(uint32_t);
probe MonitorExit-entry(void*, void*);
probe MonitorExit-return(uint32_t);
probe NewBooleanArray-entry(void*, uintptr_t);
probe NewBooleanArray-return(void*);
probe NewByteArray-entry(void*, uintptr_t);
probe NewByteArray-return(void*);
probe NewCharArray-entry(void*, uintptr_t);
probe NewCharArray-return(void*);
probe NewDirectByteBuffer-entry(void*, void*, uintptr_t);
probe NewDirectByteBuffer-return(void*);
probe NewDoubleArray-entry(void*, uintptr_t);
probe NewDoubleArray-return(void*);
probe NewFloatArray-entry(void*, uintptr_t);
probe NewFloatArray-return(void*);
probe NewGlobalRef-entry(void*, void*);
probe NewGlobalRef-return(void*);
probe NewIntArray-entry(void*, uintptr_t);
probe NewIntArray-return(void*);
probe NewLocalRef-entry(void*, void*);
probe NewLocalRef-return(void*);
probe NewLongArray-entry(void*, uintptr_t);
probe NewLongArray-return(void*);
probe NewObjectA-entry(void*, void*, uintptr_t);
probe NewObjectA-return(void*);
probe NewObjectArray-entry(void*, uintptr_t, void*, void*);
probe NewObjectArray-return(void*);
probe NewObject-entry(void*, void*, uintptr_t);
probe NewObject-return(void*);
probe NewObjectV-entry(void*, void*, uintptr_t);
probe NewObjectV-return(void*);
probe NewShortArray-entry(void*, uintptr_t);
probe NewShortArray-return(void*);
probe NewString-entry(void*, const uint16_t*, uintptr_t);
probe NewString-return(void*);
probe NewStringUTF-entry(void*, const char*);
probe NewStringUTF-return(void*);
probe NewWeakGlobalRef-entry(void*, void*);
probe NewWeakGlobalRef-return(void*);
probe PopLocalFrame-entry(void*, void*);
probe PopLocalFrame-return(void*);
probe PushLocalFrame-entry(void*, uint32_t);
probe PushLocalFrame-return(uint32_t);
probe RegisterNatives-entry(void*, void*, const void*, uint32_t);
probe RegisterNatives-return(uint32_t);
probe ReleaseBooleanArrayElements-entry(void*, void*, uintptr_t*,
uint32_t);
probe ReleaseBooleanArrayElements-return();
probe ReleaseByteArrayElements-entry(void*, void*, char*, uint32_t);
probe ReleaseByteArrayElements-return();
Chapter 10
Sample DTrace Probes
10-16

probe ReleaseCharArrayElements-entry(void*, void*, uint16_t*,
uint32_t);
probe ReleaseCharArrayElements-return();
probe ReleaseDoubleArrayElements-entry(void*, void*, double*,
uint32_t);
probe ReleaseDoubleArrayElements-return();
probe ReleaseFloatArrayElements-entry(void*, void*, float*, uint32_t);
probe ReleaseFloatArrayElements-return();
probe ReleaseIntArrayElements-entry(void*, void*, uint32_t*,
uint32_t);
probe ReleaseIntArrayElements-return();
probe ReleaseLongArrayElements-entry(void*, void*, uintptr_t*,
uint32_t);
probe ReleaseLongArrayElements-return();
probe ReleaseObjectArrayElements-entry(void*, void*, void**,
uint32_t);
probe ReleaseObjectArrayElements-return();
probe Releasey(void*, void*, void*, uint32_t);
probe ReleasePrimitiveArrayCritical-return();
probe ReleaseShortArrayElements-entry(void*, void*, uint16_t*,
uint32_t);
probe ReleaseShortArrayElements-return();
probe ReleaseStringChars-entry(void*, void*, const uint16_t*);
probe ReleaseStringChars-return();
probe ReleaseStringCritical-entry(void*, void*, const uint16_t*);
probe ReleaseStringCritical-return();
probe ReleaseStringUTFChars-entry(void*, void*, const char*);
probe ReleaseStringUTFChars-return();
probe SetBooleanArrayRegion-entry(void*, void*, uintptr_t, uintptr_t,
const uintptr_t*);
probe SetBooleanArrayRegion-return();
probe SetBooleanField-entry(void*, void*, uintptr_t, uintptr_t);
probe SetBooleanField-return();
probe SetByteArrayRegion-entry(void*, void*, uintptr_t, uintptr_t,
const char*);
probe SetByteArrayRegion-return();
probe SetByteField-entry(void*, void*, uintptr_t, char);
probe SetByteField-return();
probe SetCharArrayRegion-entry(void*, void*, uintptr_t, uintptr_t,
const uint16_t*);
probe SetCharArrayRegion-return();
probe SetCharField-entry(void*, void*, uintptr_t, uint16_t);
probe SetCharField-return();
probe SetDoubleArrayRegion-entry(void*, void*, uintptr_t, uintptr_t,
const double*);
probe SetDoubleArrayRegion-return();
probe SetDoubleField-entry(void*, void*, uintptr_t, double);
probe SetDoubleField-return();
probe SetFloatArrayRegion-entry(void*, void*, uintptr_t, uintptr_t,
const float*);
probe SetFloatArrayRegion-return();
probe SetFloatField-entry(void*, void*, uintptr_t, float);
probe SetFloatField-return();
probe SetIntArrayRegion-entry(void*, void*, uintptr_t, uintptr_t,
const uint32_t*);
Chapter 10
Sample DTrace Probes
10-17

probe SetIntArrayRegion-return();
probe SetIntField-entry(void*, void*, uintptr_t, uint32_t);
probe SetIntField-return();
probe SetLongArrayRegion-entry(void*, void*, uintptr_t, uintptr_t,
const uintptr_t*);
probe SetLongArrayRegion-return();
probe SetLongField-entry(void*, void*, uintptr_t, uintptr_t);
probe SetLongField-return();
probe SetObjectArrayElement-entry(void*, void*, uintptr_t, void*);
probe SetObjectArrayElement-return();
probe SetObjectField-entry(void*, void*, uintptr_t, void*);
probe SetObjectField-return();
probe SetShortArrayRegion-entry(void*, void*, uintptr_t, uintptr_t,
const uint16_t*);
probe SetShortArrayRegion-return();
probe SetShortField-entry(void*, void*, uintptr_t, uint16_t);
probe SetShortField-return();
probe SetStaticBooleanField-entry(void*, void*, uintptr_t, uintptr_t);
probe SetStaticBooleanField-return();
probe SetStaticByteField-entry(void*, void*, uintptr_t, char);
probe SetStaticByteField-return();
probe SetStaticCharField-entry(void*, void*, uintptr_t, uint16_t);
probe SetStaticCharField-return();
probe SetStaticDoubleField-entry(void*, void*, uintptr_t, double);
probe SetStaticDoubleField-return();
probe SetStaticFloatField-entry(void*, void*, uintptr_t, float);
probe SetStaticFloatField-return();
probe SetStaticIntField-entry(void*, void*, uintptr_t, uint32_t);
probe SetStaticIntField-return();
probe SetStaticLongField-entry(void*, void*, uintptr_t, uintptr_t);
probe SetStaticLongField-return();
probe SetStaticObjectField-entry(void*, void*, uintptr_t, void*);
probe SetStaticObjectField-return();
probe SetStaticShortField-entry(void*, void*, uintptr_t, uint16_t);
probe SetStaticShortField-return();
probe Throw-entry(void*, void*);
probe ThrowNew-entry(void*, void*, const char*);
probe ThrowNew-return(uint32_t);
probe Throw-return(uint32_t);
probe ToReflectedField-entry(void*, void*, uintptr_t, uintptr_t);
probe ToReflectedField-return(void*);
probe ToReflectedMethod-entry(void*, void*, uintptr_t, uintptr_t);
probe ToReflectedMethod-return(void*);
probe UnregisterNatives-entry(void*, void*);
probe UnregisterNatives-return(uint32_t);
};
Chapter 10
Sample DTrace Probes
10-18

11
Fatal Error Reporting
Fatal errors are errors such as native memory exhaustion, memory access errors,
or explicit signals directed to the process. Fatal errors can be triggered by native
code within the application (for example, developer-written Java Native Interface (JNI)
code), by third-party native libraries that the are used by application or the JVM, or by
native code in the JVM. If a fatal error causes the process that is hosting the JVM to
terminate, the JVM gathers information about the error and writes a crash report.
The JVM tries to identify the nature and location of the error. If possible, the JVM
writes detailed information about the state of the JVM and the process, at the time of
the crash. The details that are available can depend on the platform and the nature
of the crash. The information that is provided by this error-reporting mechanism lets
you debug your application more easily and efficiently, and helps you identify issues
in third-party code. When an error message indicates a problem in the JVM code,
you can submit a more accurate and helpful bug report. In some cases, crash report
generation causes secondary errors that prevent full details from being reported.
Error Report Example
The following example shows the start of an error report (file
hs_err_pid18240.log) for a crash in the native JNI code for an application:
#
# A fatal error has been detected by the Java Runtime Environment:
#
# SIGSEGV (0xb) at pc=0x00007f0f159f857d, pid=18240, tid=18245
#
# JRE version: Java(TM) SE Runtime Environment (9.0+167) (build 9-
ea+167)
# Java VM: Java HotSpot(TM) 64-Bit Server VM (9-ea+167, mixed mode,
tiered, compressed oops, g1 gc, linux-amd64)
# Problematic frame:
# C [libMyApp.so+0x57d] Java_MyApp_readData+0x11
#
# Core dump will be written. Default location: /cores/core.18240)
#
# If you would like to submit a bug report, please visit:
# http://bugreport.java.com/bugreport/crash.jsp
# The crash happened outside the Java Virtual Machine in native code.
# See problematic frame for where to report the bug.
#
--------------- S U M M A R Y ------------
Command Line: MyApp
Host: Intel(R) Xeon(R) CPU X5675 @ 3.07GHz, 24 cores, 141G,
Ubuntu 12.04 LTS
11-1

Time: Fri Apr 28 02:57:13 2017 EDT elapsed time: 2 seconds (0d 0h 0m 2s)
--------------- T H R E A D ---------------
Current thread (0x00007f102c013000):
JavaThread "main" [_thread_in_native, id=18245,
stack(0x00007f10345c0000,0x00007f10346c0000)]
Stack: [0x00007f10345c0000,0x00007f10346c0000],
sp=0x00007f10346be930, free space=1018k
Native frames: (J=compiled Java code, A=aot compiled Java code,
j=interpreted, Vv=VM code, C=native code)
C [libMyApp.so+0x57d] Java_MyApp_readData+0x11
j MyApp.readData()I+0
j MyApp.main([Ljava/lang/String;)V+15
v ~StubRoutines::call_stub
V [libjvm.so+0x839eea] JavaCalls::call_helper(JavaValue*,
methodHandle const&, JavaCallArguments*, Thread*)+0x47a
V [libjvm.so+0x896fcf] jni_invoke_static(JNIEnv_*, JavaValue*,
_jobject*, JNICallType, _jmethodID*, JNI_ArgumentPusher*, Thread*)
[clone .isra.90]+0x21f
V [libjvm.so+0x8a7f1e] jni_CallStaticVoidMethod+0x14e
C [libjli.so+0x4142] JavaMain+0x812
C [libpthread.so.0+0x7e9a] start_thread+0xda
Java frames: (J=compiled Java code, j=interpreted, Vv=VM code)
j MyApp.readData()I+0
j MyApp.main([Ljava/lang/String;)V+15
v ~StubRoutines::call_stub
siginfo: si_signo: 11 (SIGSEGV), si_code: 1 (SEGV_MAPERR), si_addr:
0x0000000000000000
Chapter 11
Error Report Example
11-2

12
Java Virtual Machine Related Resources
The following related links are related to the JVM.
• java.lang.invoke package documentation
• The Da Vinci Machine Project
Tools
You can control some operating characteristics of the Java HotSpot VM by using
command-line flags. For more information about the Java application launcher, see
The java Command in the Java Development Kit Tool Specifications.
12-1
