
© Copyright Netsurion. All Rights Reserved. 1
Integration Guide
Integrate Forcepoint Data Loss Prevention
(DLP)
EventTracker v9.2 and later
Publication Date:
May 11, 2021

© Copyright Netsurion. All Rights Reserved. 2
Abstract
This guide helps you in configuring Forcepoint DLP with EventTracker to receive Forcepoint DLP events. In
this guide, you will find the detailed procedures required for monitoring Forcepoint DLP.
Scope
The configuration details in this guide are consistent with EventTracker version 9.2 and later, Forcepoint
DLP v8.4.x.
Audience
Administrators who are assigned the task to monitor and manage Forcepoint DLP events using EventTracker.

© Copyright Netsurion. All Rights Reserved. 3
Table of Contents
Table of Contents 3
1. Overview 4
2. Prerequisites 4
3. Integrating Forcepoint events to EventTracker 4
3.1 Setting up SIEM integration 4
3.1.1 Creating a new administrator contact for Forcepoint storage 4
3.1.2 Enabling SIEM logging 5
3.1.3 Scheduling log file download for Forcepoint storage 6
4. EventTracker Knowledge Pack 7
4.1 Categories 7
4.2 Reports 7
4.3 Dashboards 8
5. Importing knowledge pack into EventTracker 9
5.1 Categories 10
5.2 Flex Reports 11
5.3 Knowledge Objects 13
5.4 Dashboards 14
6. Verifying knowledge pack in EventTracker 15
6.1 Categories 15
6.2 Flex Reports 16
6.3 Knowledge Objects 16
6.4 Dashboards 16
About Netsurion 18
Contact Us 18

© Copyright Netsurion. All Rights Reserved. 4
1. Overview
Forcepoint Data Loss Prevention (DLP) endpoint is a comprehensive, secure, and easy-to-use endpoint data
loss prevention solution. It monitors real-time traffic and applies customized security policies over
application and storage interfaces, as well as for data discovery.
Forcepoint DLP integrator can forward the events to EventTracker. Forcepoint DLP sends events like traffic
events, system events, and audit events. With this events EventTracker can generate reports for traffic
activities which are accessed by users. It will show graphical representation like traffic activities by action,
traffic activities by destination location, and activities by URL and action, etc.
2. Prerequisites
• Admin access to Forcepoint web interface.
• Perl language should be Install on windows machine.
3. Integrating Forcepoint events to EventTracker
3.1 Setting up SIEM integration
SIEM logging permissions are available by default. To set up SIEM logging in the cloud portal:
1. Create a new administrator contact for Forcepoint storage.
We strongly recommend that the log download process has its own username and password to gain
access to the Forcepoint Web Security Cloud service. This keeps the process separate from other
administration tasks and enables you to establish longer password expiration policies.
2. Enable SIEM logging.
3. Schedule log file download for Forcepoint storage.
3.1.1 Creating a new administrator contact for Forcepoint storage
To create the new contact:
1. In the cloud portal, on the main toolbar, click Account, then select Contacts.
2. Under the Contacts list, click Add.
3. Enter identifying information for the new contact in the First name and Surname fields. For
example, SIEM and Logging.
4. Click Submit.
5. Click the link provided to supply a Username for the account.

© Copyright Netsurion. All Rights Reserved. 5
6. Enter a password for the contact. It must conform to the password policy on the main Contacts
page.
7. Enter a password expiration date for the contact. To avoid having to regularly update it, this should
be different than the regular account settings; it should span for a longer period. The maximum
period is 365 days.
8. Under Account Permissions, check the Log Export box, and any other permissions you want to give
this user. You can act as an administrator from this logon.
Note: If you provide only the Log Export permission contact, the username and password cannot be
used to log on to the cloud portal. Although log on permissions is not needed to run the download
script. The View Reports permission is the minimum permission a user needs to be able to log on.
Minimum permissions should be given to this user. The user password is needed to run the script and is
viewable in plain text. For that reason, it is recommended that this user will not be the one, with
permissions to modify reports or account policies.
9. Click submit.
3.1.2 Enabling SIEM logging
1. Use the Account > SIEM Storage page of the cloud portal to configure the storage options for SIEM
output generated on the Reporting > Account Reports > SIEM Integration page.
2. The Reporting > Account Reports > SIEM Integration page is used to format reporting data for use
by a third-party SIEM tool and enable the generation of the log files.
Note:
Using Forcepoint storage
To get the formatted SIEM data to your network when Forcepoint storage has been selected as the
Storage type on the SIEM Storage page, you can use the sample Perl script included in the zip file linked
at the top of the SIEM integration page.

© Copyright Netsurion. All Rights Reserved. 6
The account used to run this script is the one created in “Create a new administrator contact for
Forcepoint storage”.
In the Help tab, view Running the SIEM log file download script for Forcepoint Storage for details on
formatting the data and downloading and using the script.
3.1.3 Scheduling log file download for Forcepoint storage
Once you have run an initial download and determined the parameters you want to use in your script, set up
a scheduled service to run automatic downloads.
We recommend that you download the log files at least once a day. To avoid periods of high network traffic,
select a random time for the download (for example, somewhere between 10 and 50 minutes past the
hour).
Scheduling on Windows
Before scheduling downloads from the cloud service, make sure that the Windows Task Scheduler service is
started. To check this:
1. Open the Windows Services tool.
2. Scroll down to Task Scheduler.
• If the status is started, leave it the way it is.
• Otherwise, click Start or Resume to start the service.
To schedule the log file download:
1. Open the Windows Scheduled Tasks tool.
2. Select Add/Create Scheduled Task.
3. Work through the Scheduled Task Wizard. Note that the steps involved may differ for each
Windows version.
• The network username and password you provide is not the username and password you set up
in the cloud portal.
• The following settings are required as part of actions to successfully run the download script:
o Program: <full path>\perl.exe.
o Additional Arguments: <full path>\log_export_siem_v2_0.pl -- cfgfile
<full path>\log_export_siem.cfg
o Start in: enter the full path to the script.
• Mark the Open the properties.... checkbox, then click Finish.
4. Define the task:
• To run as the user defined in “Create a new administrator contact for Forcepoint storage”,
using the password defined for that user.
• To download the file to a designated local destination.
5. Click OK.
Note: Click here to check the passing parameters on how to provide destination path for downloading log
files in logfile download script. Capture log files downloading location for future purpose.
Send downloaded log files to EventTracker by using Integrator.

© Copyright Netsurion. All Rights Reserved. 7
1. Click to download the “Forcepoint DLP integrator” files.
2. Run Forcepoint DLP integrator and provide details.
o Folder Location: Browse captured destination log files downloaded location.
o Organization: Provide organization id.
3. Click Finish.
4. EventTracker Knowledge Pack
Once logs are received into EventTracker; alerts, reports can be configured into EventTracker.
The following knowledge packs are available in EventTracker to support Windows.
4.1 Categories
• Forcepoint DLP: Activities – This category provides information related to web traffic activities
accessed by user.
4.2 Reports
• Forcepoint DLP - Activities – This report provides information related to user accessed web traffic
activities. It contains the field information like, action, category name, risk class, source IP,
destination IP, URL, total bytes received, total bytes sent, referral URL, threat type, etc.
• Log_Sample
Date : 26/04/2021
Time : 13:56:45
Action : Allowed
Category Name : Information Technology
Parent Category Name : Information Technology
Policy Name : Premex
Risk Class : Business Usage
User : [email protected]
Workstation : wksts-7-131
URL - Full : HTTPS://www.googletagservices.com/activeview/js/current/rx_lidar.js
Destination IP : 142.20.17.21
Severity : None
Connection IP : 89.6.19.29
Connection IP City : None
Connection IP Country : United Kingdom
Destination IP Country : United States
Threat Name : None

© Copyright Netsurion. All Rights Reserved. 8
Threat Type : None
Referrer URL : https://40b475c4e233ad17e997cfc3db6ee1b.safeframe.googlesyndication.com/
Bytes Received : 37022
Bytes Sent : 862
Authentication Method : NTLM
HTTP Status Code : 200
Port : 443
Sample_report
4.3 Dashboards
• Forcepoint DLP – Activities by action
• Forcepoint DLP – Activities by destination location
• Forcepoint DLP: Activities by categories and action

© Copyright Netsurion. All Rights Reserved. 9
• Forcepoint DLP: Activities by URL and action
5. Importing knowledge pack into EventTracker
NOTE: Import knowledge pack items in the following sequence:
• Categories
• Flex Reports
• Knowledge Objects
• Dashboards
1. Launch the EventTracker Control Panel.
2. Double click Export-Import Utility.

© Copyright Netsurion. All Rights Reserved. 10
Export-Import Utility window opens.
3. Click the Import tab.
5.1 Categories
1. In Export-Import Utility window, select the Category option, and click Browse .
2. Navigate to the knowledge pack folder and select the file with the extension “.iscat”, like
Categories_Forcepoint . iscat and click Import.

© Copyright Netsurion. All Rights Reserved. 11
EventTracker displays a success message.
5.2 Flex Reports
1. In Export-Import Utility window, select the Import tab. Click the Reports option, and choose New
(*.etcrx).

© Copyright Netsurion. All Rights Reserved. 12
2. A new pop-up window appears. Click the Select File button and navigate to the knowledge pack folder
and select file with the extension “.etcrx”, e.g., “Reports_Forcepoint .etcrx”.
3. Wait while reports populate. Select all the relevant reports and click Import .
EventTracker displays a success message.

© Copyright Netsurion. All Rights Reserved. 13
5.3 Knowledge Objects
1. Click Knowledge objects under the Admin option in the EventTracker web interface.
2. Click the import object icon.
3. A pop-up box appears, click Browse and navigate to the knowledge packs folder (type “C:\Program
Files (x86)\Prism Microsystems\EventTracker\Knowledge Packs” in the navigation bar) with the
extension “.etko”, e.g., “KO_Forcepoint .etko” and click Upload.

© Copyright Netsurion. All Rights Reserved. 14
4. Wait while EventTracker populates all the relevant knowledge objects. Once the objects are displayed,
select the required ones, and click Import.
5.4 Dashboards
1. Login to the EventTracker web interface.
2. Navigate to Dashboard → My Dashboard.
3. In My Dashboard, Click the Import button.

© Copyright Netsurion. All Rights Reserved. 15
4. Click Browse and navigate to the knowledge pack folder (type “C:\Program Files (x86)\Prism
Microsystems\EventTracker\Knowledge Packs” in the navigation bar) where “.etwd”, e.g.,
“Dashboard_Forcepoint .etwd” is saved and click Upload.
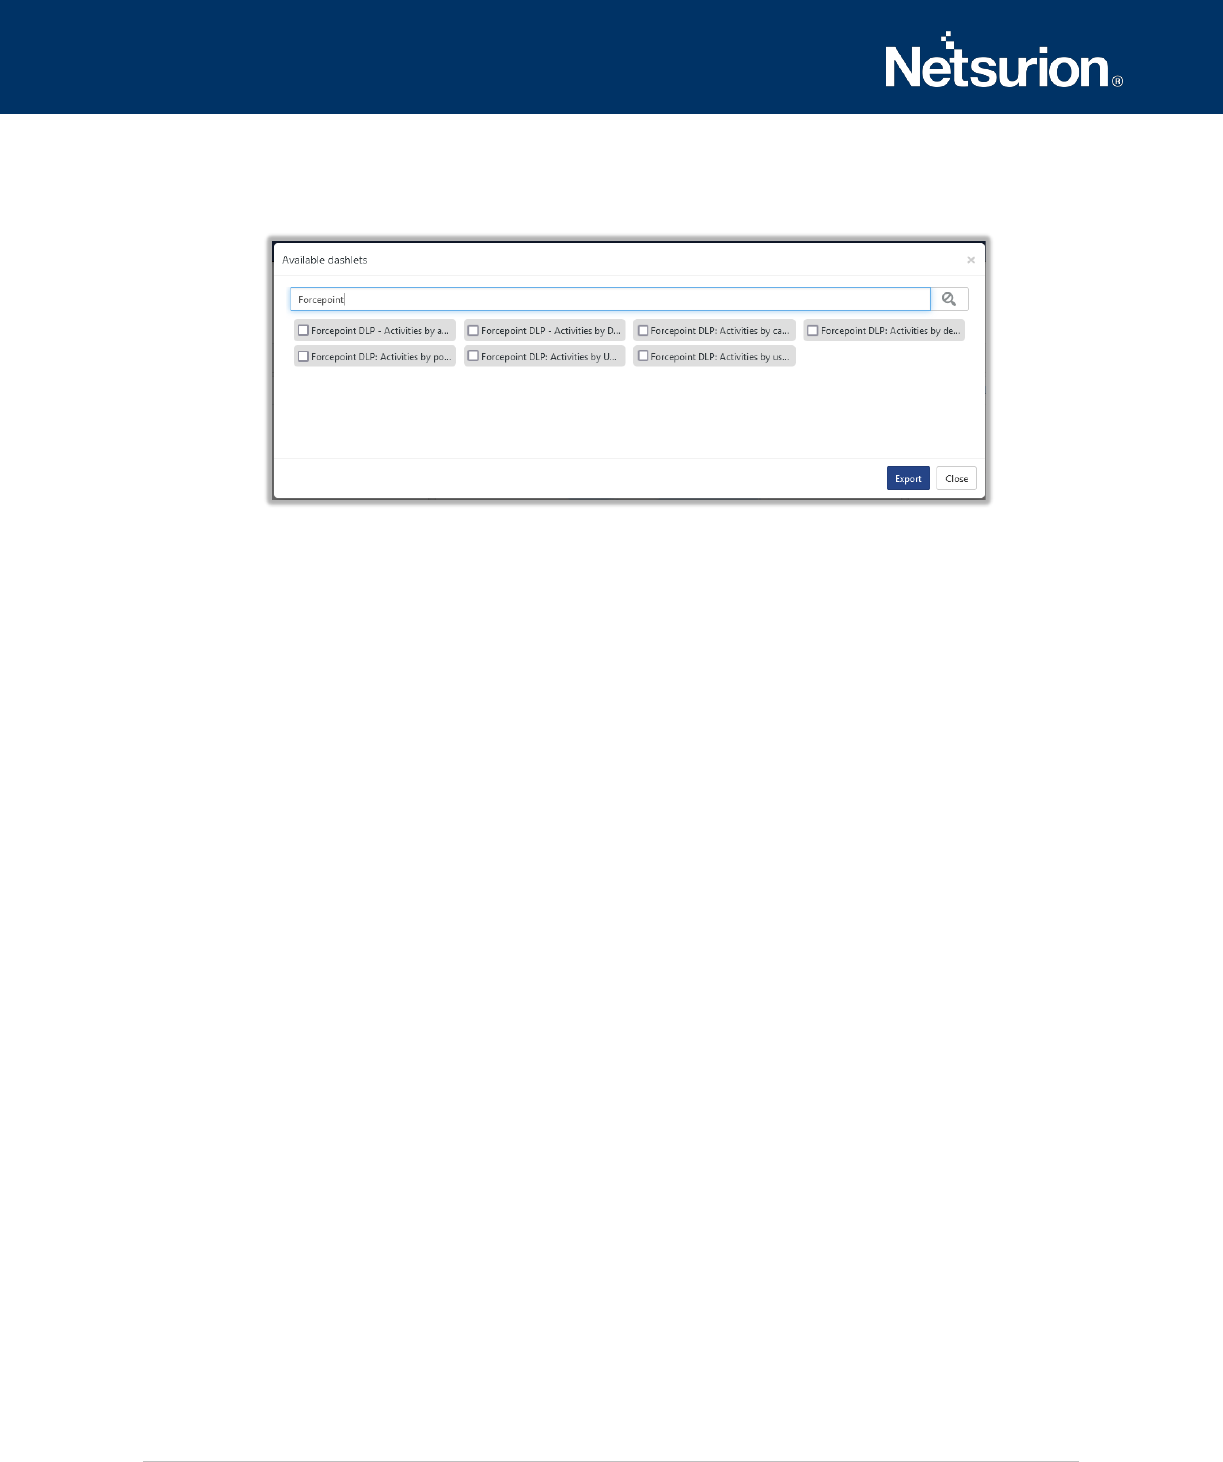
5. Wait while EventTracker populates all the available dashboards. Enable Select All and click Import.
6. Verifying knowledge pack in EventTracker
6.1 Categories
1. Login to the EventTracker web interface.
2. Click Admin dropdown and click Categories.
3. In Category Tree to view imported categories, click the Search tab and enter Forcepoint in the search.

© Copyright Netsurion. All Rights Reserved. 16
6.2 Flex Reports
1. In the EventTracker web interface, click the Reports menu, and then select the Report Configuration.
2. In the Reports Configuration pane, select the Defined option.
3. Click on the Forcepoint group folder to view the imported reports.
6.3 Knowledge Objects
1. In the EventTracker web interface, click the Admin dropdown, and then click Knowledge Objects.
2. In the Knowledge Object tree, expand the Forcepoint group folder to view the imported Knowledge
objects.
6.4 Dashboards
1. In the EventTracker web interface, Click Home and select My Dashboard.
© Copyright Netsurion. All Rights Reserved. 17
2. In the Forcepoint dashboard you see the following screen.

© Copyright Netsurion. All Rights Reserved. 18
About Netsurion
Flexibility and security within the IT environment are two of the most important factors driving business
today. Netsurion’s cybersecurity platforms enable companies to deliver on both. Netsurion’s approach of
combining purpose-built technology and an ISO-certified security operations center gives customers the
ultimate flexibility to adapt and grow, all while maintaining a secure environment.
Netsurion’s EventTracker cyber threat protection platform provides SIEM, endpoint protection, vulnerability
scanning, intrusion detection and more; all delivered as a managed or co-managed service.
Netsurion’s BranchSDO delivers purpose-built technology with optional levels of managed services to multi-
location businesses that optimize network security, agility, resilience, and compliance for branch locations.
Whether you need technology with a guiding hand or a complete outsourcing solution, Netsurion has the
model to help drive your business forward. To learn more visit netsurion.com or follow us
on Twitter or LinkedIn. Netsurion is #19 among MSSP Alert’s 2020 Top 250 MSSPs.
Contact Us
Corporate Headquarters
Netsurion
Trade Centre South
100 W. Cypress Creek Rd
Suite 530
Fort Lauderdale, FL 33309
Contact Numbers
713-929-0200
https://www.netsurion.com/company/contact-us
