
City of Ontario, California
Engineering Department
Fiber Optic Master Plan
September 2013
Prepared by:

City of Ontario, California
Fiber Optic Master Plan
2 | P a g e
Table of Contents
Executive Summary ............................................................................................ 7
Introduction........................................................................................................ 8
Previous Studies ........................................................................................................................................ 8
Scope of Work ........................................................................................................................................... 8
Acknowledgements ................................................................................................................................... 9
Study Area ........................................................................................................ 10
Old Model Colony – General Boundaries ................................................................................................ 10
New Model Colony – General Boundaries .............................................................................................. 10
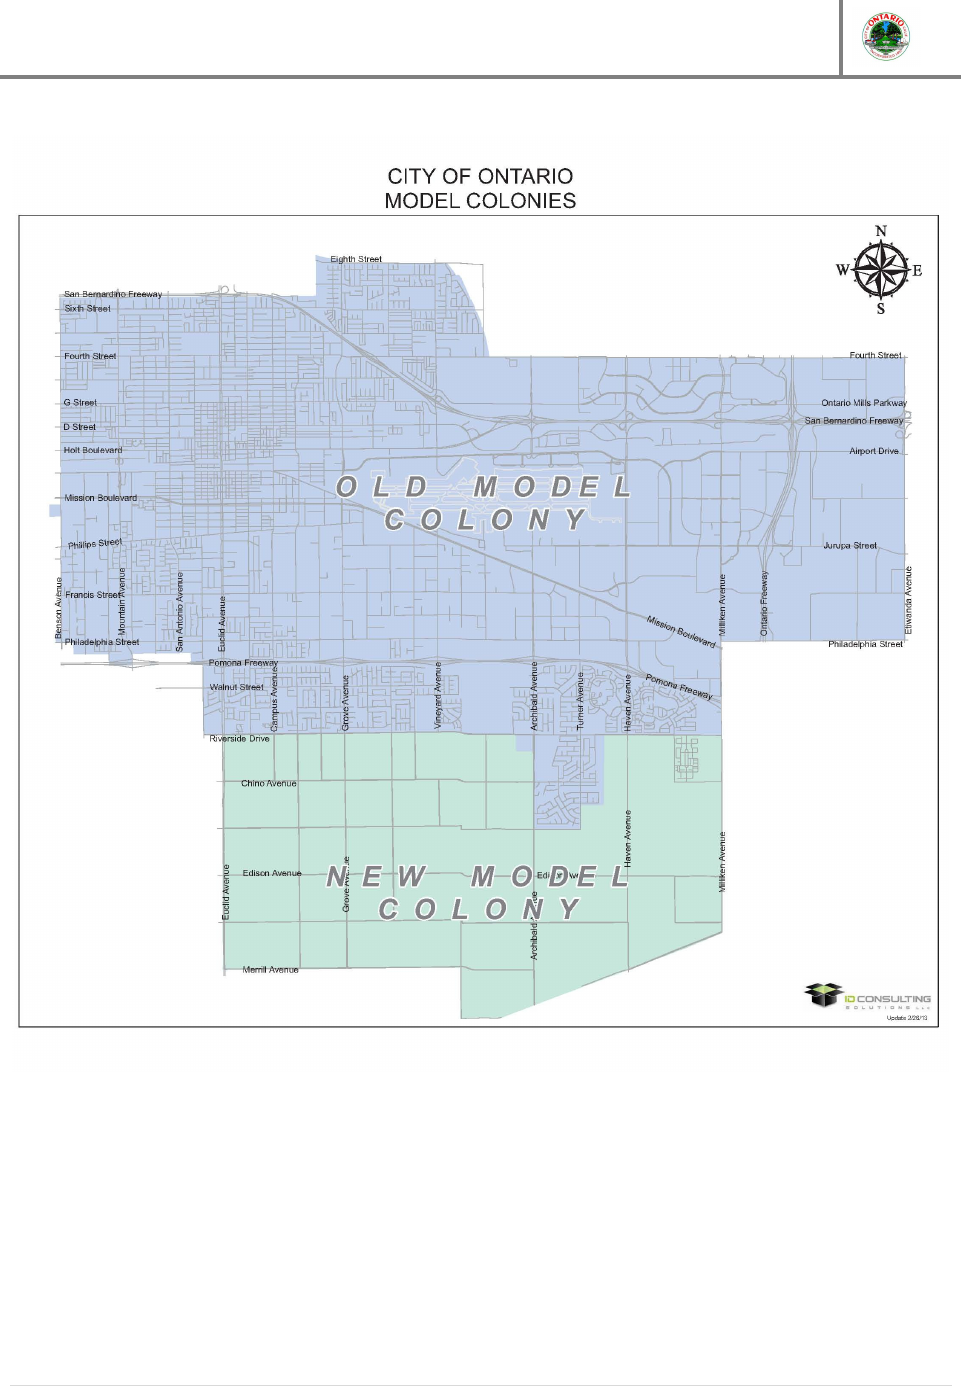
Figure 1 – City of Ontario Model Colonies .......................................................................................... 11
Old Model Colony (OMC) ........................................................................................................................ 11
New Model Colony (NMC) ...................................................................................................................... 12
DATA 101 – A Technology Primer ........................................................................................................... 12
File Sizes .............................................................................................................................................. 12
Network Speeds .................................................................................................................................. 12
Bandwidth ........................................................................................................................................... 12
Infrastructure Locations .................................................................................... 13
Fiber ........................................................................................................................................................ 13
POPs & Electronics .................................................................................................................................. 13
Figure 2 – City of Ontario Facilities Map (OMC & NMC) ..................................................................... 14
Figure 3 – OMC Ring and Lateral Fiber Optic Cabling ......................................................................... 15
Figure 4 – NMC Ring and Lateral Footages ......................................................................................... 17
Figure 5 – OMC Implementation Phases and Footages ...................................................................... 19
Figure 6 – OMC Fiber Size and Footages ............................................................................................. 20
Figure 7 – NMC Fiber Size and Footages ............................................................................................. 22
Implementation Phasing Plan ........................................................................... 23
Overview ................................................................................................................................................. 23
Old Model Colony (OMC) & New Model Colony (NMC) ......................................................................... 24

City of Ontario, California
Fiber Optic Master Plan
3 | P a g e
Primary Ring – Phase I ......................................................................................................................... 24
Secondary Ring – Phase II ................................................................................................................... 24
Laterals (Future Phases) ...................................................................................................................... 25
Building / POP Interconnect .................................................................................................................... 26
OMC WEST - City Hall (Existing Facility) .................................................................................................. 26
Figure 8 - OMC WEST - City Hall (Existing Facility) .............................................................................. 27
NMC EAST - Riverside Facility (Existing Facility) ..................................................................................... 27
Figure 9 - NMC EAST (Riverside Facility) - Facility Layout Plan ........................................................... 28
Figure 10 - NMC EAST (Riverside Facility) - Site Layout Plan .............................................................. 29
OMC EAST (City Arena Vicinity) / NMC WEST (Centennial Park Vicinity) ............................................... 29
Precast Shelters ................................................................................................................................... 29
Figure 11 – OMC EAST / NMC WEST Typical Layout ........................................................................... 30
Existing Duct Utilization .......................................................................................................................... 30
Figure 12 – Existing Conduit Utilization .............................................................................................. 31
Capacity Analysis .............................................................................................. 31
Current .................................................................................................................................................... 31
Table 1 – Existing Communication Circuit Counts .............................................................................. 31
Table 2 – Estimated Communication Circuit Expense Per Month ...................................................... 32
Future ...................................................................................................................................................... 32
Figure 13 – Carrier Circuit Usage / Monthly Charges ......................................................................... 33
Figure 14 – Adding 1 Gbps Leased Circuits / Monthly Charges .......................................................... 34
Figure 15 – Historical CITY IP Internet Drain Data Rate (Mbps) .......................................................... 35
Bandwidth (Demand) Analysis .......................................................................... 35
Figure 16 – Current CITY Network Schematic ..................................................................................... 36
Figure 17 – Proposed CITY Network Schematic .................................................................................. 37
System Goals .................................................................................................... 41
Initial CITY Municipal Network Goals ...................................................................................................... 41
Implementation Costs ....................................................................................... 41
Budget Category Detail ........................................................................................................................... 42
Table 3 – Project Budget Detail – Phase 1 .......................................................................................... 43

City of Ontario, California
Fiber Optic Master Plan
4 | P a g e
Table 4 - Project Budget Detail – Phase 2 ........................................................................................... 44
Implementation Cost Summary .............................................................................................................. 45
Table 5 – Phase 1 & 2 Cost Summary .................................................................................................. 45
Table 6 – POP Facility Cost Detail........................................................................................................ 45
Figure 18 – Eight Year Cumulative Cost – Current Systems ................................................................ 46
Figure 19 - Eight Year Cumulative Cost Detail – CITY Fiber Optic Network ........................................ 47
Figure 20 - Eight Year Cumulative Cost – Leased Circuits ................................................................... 48
Figure 21 – Eight Year Cumulative Costs – Current, CITY Fiber Optic Networks, & Leased Circuits ... 49
Figure 22 – Capital Cost Analysis ........................................................................................................ 50
Figure 23 – Year-by-Year Cash Costs – CITY Fiber Optic Network ...................................................... 51
APPENDIX A - SUPPORTING DOCUMENTS…………………………………………………..52
Maintenance Requirements .............................................................................. 52
Updated Development Guidelines .......................................................................................................... 54
Figure 24 – Recommended Standard Drawing ................................................................................... 54
Design Guidelines ............................................................................................. 55
General Overview ................................................................................................................................... 55
Drafting Standards .................................................................................................................................. 56
Fiber Optic Plan Standards ...................................................................................................................... 57
Fiber Optic Design – Old Model Colony .................................................................................................. 57
Fiber Optic Design – New Model Colony ................................................................................................ 58
Fiber Optic Standards.............................................................................................................................. 58
Conduit Standards ................................................................................................................................... 59
Primary Ring (PR) ................................................................................................................................ 59
Secondary Ring (SR) ............................................................................................................................ 59
Laterals ................................................................................................................................................ 59
Handhole Placement ............................................................................................................................... 59
Handhole Utilization - Fiber Strand Count .............................................................................................. 59
Table 7 – Handhole Utilization – Fiber Strand Count .......................................................................... 59
General Handhole Spacing Requirements .............................................................................................. 60
Bid Quality Standard Drawings & Specifications ............................................... 60

City of Ontario, California
Fiber Optic Master Plan
5 | P a g e
Primary Ring (PR) .................................................................................................................................... 61
Design Guideline Figure 1 – Primary Ring (PR) ................................................................................... 61
Primary Ring Plus (+) 2” Duct (PR+2”) ..................................................................................................... 62
Design Guideline Figure 2 – Primary Ring Plus (+) 2” Duct (PR+2”) .................................................... 62
Secondary Ring (SR) ................................................................................................................................ 63
Design Guideline Figure 3 – Secondary Ring (SR) ............................................................................... 63
CIP Joint Build (Stepped Trench Detail) .................................................................................................. 64
Design Guideline Figure 4 – CIP Joint Build (Stepped Trench Detail) ................................................. 64
Trench Detail Notes ............................................................................................................................ 65
Directional Bore Detail ............................................................................................................................ 66
Design Guideline Figure 5 - Directional Bore Detail ............................................................................ 66
Handhole Conduit Entry Detail ............................................................................................................... 67
Design Guideline Figure 6 - Handhole Conduit Entry Detail ............................................................... 67
Conduit Sweep Details (Joint Trench Installation) .................................................................................. 68
Design Guideline Figure 7 - Conduit Sweep Details (Joint Trench Installation) .................................. 68
Glossary ............................................................................................................ 69
Acronyms.......................................................................................................... 71
Reference Documents ....................................................................................... 72
Technical Memorandum – System Inventory Memorandum................................................................. 72
Conceptual Layout & Needs Assessment Memorandum ....................................................................... 72
Concept of Operations ............................................................................................................................ 72
Fiber Optic Conduit Design Guidelines ................................................................................................... 72
Fiber Optic Design Submittal Checklist ................................................................................................... 72
SUPPORTING DOCUMENTS ............................................................................... 73
1. Map Table Index.............................................................................................................................. 73
2. Phase 1 Construction ...................................................................................................................... 73
2.1. Building Interconnections ....................................................................................................... 73
2.2. Traffic Signals .......................................................................................................................... 74
2.3. Well Aggregation Sites ............................................................................................................ 75
2.4. CIP Projects ............................................................................................................................. 76

City of Ontario, California
Fiber Optic Master Plan
6 | P a g e
3. Phase 2 Construction ...................................................................................................................... 76
3.1. Building Interconnections ....................................................................................................... 76
3.2. Traffic Signals .......................................................................................................................... 76
3.3. Well Aggregation Site .............................................................................................................. 77
3.4. CIP Projects ............................................................................................................................. 77
4. Phase - Future Construction ........................................................................................................... 78
4.1. Building Interconnections ....................................................................................................... 78
4.2. Traffic Signals – OMC .............................................................................................................. 78
4.3. Traffic Signals – NMC .............................................................................................................. 82
4.4. Well Aggregation Sites ............................................................................................................ 83
4.5. CIP Projects ............................................................................................................................. 83
5.
Fiber Optic Design Submittal Checklist ..................................................... 86
APPENDIX B – DETAILED BUDGETS .................................................................... 89
Figure 25 - Infrastructure Budget - Phase 1 ........................................................................................ 89
Figure 26 - Core Electronics – Phase 1 ................................................................................................ 90
Facilities – Phase 1 .................................................................................................................................. 91
Figure 27 - POP Details - NMC EAST .................................................................................................... 91
Facilities – Phase 1 .................................................................................................................................. 92
Figure 28 - POP Details - OMC EAST / NMC WEST (Future) ................................................................ 92
Building Entrance Links – Phase 1 ........................................................................................................... 93
Figure 29 - Building Entrance Links - Phase 1...................................................................................... 93
Traffic & Water Interconnections – Phase 1 ........................................................................................... 94
Figure 30 - Traffic & Water Interconnections – Phase 1 ..................................................................... 94
Figure 31 - Infrastructure Budget - Phase 2 ........................................................................................ 95
Electronics – Phase 2............................................................................................................................... 96
Figure 32 - Electronics - Phase 2 ......................................................................................................... 96
Building Entrance Links – Phase 2 ........................................................................................................... 97
Figure 33 - Building Entrance Links - Phase 2...................................................................................... 97
Traffic & Water Interconnections – Phase 2 ........................................................................................... 98
Figure 34 - Traffic & Water Interconnections - Phase 2 ...................................................................... 98

City of Ontario, California
Fiber Optic Master Plan
7 | P a g e
Executive Summary
This milestone document is to be used by the City of Ontario (CITY) for the planning, budgeting,
and implementation of a progressive and visionary Fiber Optic Infrastructure
(INFRASTRUCTURE) project. While this document represents years of collective development
efforts, it is only complete and correct at this point in time, and will require periodic maintenance
as a “living and breathing” document to follow growth and development within the CITY’s
metropolitan area.
The proposed infrastructure, composing of approximately 19 miles of backbone fiber north of
Riverside Drive and approximately 23 miles of backbone fiber south of Riverside Drive, is an
investment into a long term capital asset using newly constructed and existing conduit to
provide high speed communication links to key locations throughout the CITY. The primary
“transport layer” will provide for a 10 Gbps data transport speed, while the “access layer” will
have a 1 Gbps data transport speed. Based on the costs of purchasing comparable bandwidth
available on the proposed network, the project would have an 8 year return on investment.
Using the current leased bandwidth as a comparison, the approximate return on investment
would be 20 years. This seems to be reasonable considering that this asset will be used by the
CITY for an interminable period.
The benefits to be realized from deployment of this INFRASTRUCTURE are both immediate
and long-term. The near term impact will be the transfer of ongoing montly expenses currently
committed to communication carrier, to a CITY-owned and managed resource that will provide a
level of service and performance not otherwise commercially available for a comparable cost.
Secondly, the CITY will be empowered to compete at an advanced level with their Economic
Development initiatives to attract and support industries that depend upon advanced
telecommunication infrastructure. Finally, the CITY will have a long-term resource that will
represent unparalleled performance for the next 30 years and beyond, do deliver outstanding
efficiencies for the benefit of the CITY’s businesses and residents.
We want to emphasize that this INFRASTRUCTURE is far beyond a “like-for-like” replacement
project. The proposed project includes an extensive and scalable fiber INFRASTRUCTURE
that will be owned and operated by the CITY. The project would ensure local control, security
and avoid trending cost increases of leased services. Moreover, it will enable and support future
capabilities and initiatives that will not only reduce costs, but represent technology
improvements that can impact on CITY building access control, surveillance video, and public
safety.
Future CITY initiatives could include use of traffic signal infrastructure to enable wireless
network capabilities, which could deliver secure communications for first responders. Video
capabilities could be extended to improve traffic management, and end-of-life utility assets can
be migrated onto this new INFRASTRUCTURE as legacy wireless systems are retired. The
benefits available are far beyond the costs and risks of deployment; it could be reasonably
argued that the costs / risks of non-deployment are even greater.

City of Ontario, California
Fiber Optic Master Plan
8 | P a g e
Introduction
The City of Ontario provides municipal services to a population of approximately 167,000
residents, as well as commercial, industrial, public and agricultural lands and the Ontario
International Airport, within its service area. The CITY recognizes its responsibility to efficiently
meet the citizen’s needs with long-range planning efforts. This is the basis behind the initiative
to develop a Fiber Optic Master Plan for the municipality that would address the CITY’s
immediate and near-term telecommunications demands, while establishing the infrastructure to
meet future needs in a cost-effective and fiscally responsible manner. This report is intended to
illustrate a foundation, and to provide a comprehensive planning guide for establishing and
upgrading the CITY’s telecommunication infrastructure and services offering.
Previous Studies
Previous studies completed and utilized in the development of this Fiber Optic Master Plan
include the following:
Transportation System Communication Master Plan, November 2007
The Ontario Plan (General Plan), February 2010
Capital Improvement Program, Fiscal Year 2011 – 12 , 5 Year Plan
Scope of Work
The scope of work for the development of this master plan consists of the following:
I – Project Management
Work Plan
Progress Reporting
II – System Inventory
Technical Memorandum on System Inventory
Map of Existing System Inventory
III – Needs Assessment
Technical Memorandum on Needs Assessment
Conceptual Layout of Needed Infrastructure
Concept of Operations
IV – Fiber Optic Master Plan
Description of Area
Bandwidth Analysis
System Goals and Recommendations
Capacity Analysis – Current / Future
Locations of Fiber Optic Infrastructure, Equipment and Point of Connection

City of Ontario, California
Fiber Optic Master Plan
9 | P a g e
Implementation Phasing Plan
Implementation Costs and Schedule
Design Guideline
Bid Quality Standard Drawings and Specifications
Maintenance Requirements and Costs
Potential Update of development guidelines and policies
Acknowledgements
ID Consulting Solutions would like to express their sincere appreciation to the following
individuals for their valuable assistance, feedback and support throughout the preparation of the
CITY’s Fiber Optic Master Plan:
• Building Department – Kevin Shear
• Economic Development & Planning – Charity Hernandez, Jacob Green, Jerry Blum,
Cathy Wahlstrom, Scott Murphy
• Fire Department – Floyd Clark, Raymond Ramirez
• Information Technology (IT) Department – Elliott Ellsworth, Jimmy Chang, Dale Wishner
• Parks & Maintenance Department – Dale Adcock, Roberto Perez
• Police Department – Darryl Polk, Eric Weidner, Scott Melendrez
• Engineering Department – Mauricio Diaz, Steve Latino, Khoi Do, Mike Eskander
• Utilities Department – Tom O’Neill

City of Ontario, California
Fiber Optic Master Plan
10 | P a g e
Study Area
The study area, illustrated in Figure 1 below, coincides with the City of Ontario boundary. It is
located approximately 25 miles east of downtown Los Angeles, and encompasses
approximately 49 square miles of residential, commercial, industrial, public and agricultural
lands as well as the Ontario International Airport. It is bordered by the Cities of Chino and
Montclair on the west; the Cities of Upland and Rancho Cucamonga on the north; the cities of
Fontana and Eastvale on the east; and Riverside County, and the City of Chino on the south.
The major highways crossing through portions of the study area include the San Bernardino
Freeway (I-10) on the north, the Pomona Freeway (SR-60) on the south, and the Ontario
Freeway (I-15) on the east.
For the purpose of the Fiber Optic Master Plan, the CITY is referred to and broken down in two
different areas, Old Model Colony (OMC) and New Model Colony (NMC). The two areas are
generally divided by Riverside Drive.
Old Model Colony – General Boundaries
• Northern Boundary – Generally along Fourth St. / Eighth St. / San Bernardino Freeway
• Southern Boundary – Along border with NMC, generally along Riverside Drive
• Eastern Boundary – Generally along Etiwanda Avenue
• Western Boundary – Generally along Benson Avenue
New Model Colony – General Boundaries
• Northern Boundary – Along border with OMC, generally along Riverside Drive
• Southern Boundary – Generally along Merrill Avenue
• Eastern Boundary – Generally along Milliken Avenue
• Western Boundary – Generally along Euclid Avenue
OMC consists of existing residential, commercial, and industrial developments. NMC comprises
approximately 13 square miles and currently consists of primarily agricultural land. The CITY’s
2010 General Plan details plans to develop the agricultural lands in NMC into a mix of
residential, commercial, industrial and public uses. The ultimate residential population of NMC
is expected to reach 162,518. Development of NMC has begun with the construction of the
Brookfield Homes Development, Edenglen, located southwest of the intersection of Riverside
Drive and Mill Creek Avenue.
City of Ontario, California
Fiber Optic Master Plan
11 | P a g e
Figure 1 – City of Ontario Model Colonies
Old Model Colony (OMC)
As described and referred to throughout the Fiber Optic Master Plan and supporting documents,
OMC is the established Colony and, as such, has significant existing residential, commercial,
industrial developments and municipal locations. Accordingly, Phase I and Phase II of the Fiber
Optic Communication Infrastructure will be concentrated in OMC.

City of Ontario, California
Fiber Optic Master Plan
12 | P a g e
New Model Colony (NMC)
Due to the NMC being a planned, annexed portion of the CITY, and the development of the
Colony being driven by the developers, it is not possible to project any “Phase” or calendar-
based deployment plan. The fiber optic conduit infrastructure and connectivity will be added
over time, and will be supported by the infrastructure required of willing developers. Important
to note however, the NMC already has a requirement that any developed land must install and
provide fiber conduit to all improved lots.
DATA 101 – A Technology Primer
Frequently, units are used in discussion of technology, but not everyone may know what they
mean or what they measure. Here are quick definitions for the three most common technology
references – file sizes, transport speeds, and bandwidth.
File Sizes
File sizes are expressed in Bytes, which contain 8 bits of data. Think of Bytes like words, and
bits like letters. The most common uses of file sizes are Kilobytes (expressed with a capital B,
as in KB, and contain 1,024 Bytes), Megabytes (MB, which contain 1,024 KB), and Gigabytes
(GB, and these contain 1,024 MB). It’s a rough approximation, but it makes it easier to relate
these terms: think of KB as thousands, MB as millions, and GB as billions of bytes.
Network Speeds
Network / transfer speeds are expressed differently – as in bits per second (bps). When data is
moved, the formatting of “words” (bytes) is no longer relevant, it’s just 1’s and 0’s – moving data
files across a network or from place to place, these transfer speeds determine system
performance and response time for the users. Almost like the terms above, the most common
rates are expressed in units like: Kilobits per second (Kbps) or 1,024 bits per second, Megabits
per second (Mbps) or 1,024 Kilobits per second, and Gigabits per second (Gbps) or 1,024
Megabits per second.
In this Master Plan, there are references to several speeds, including T-1 circuits (1.544 Mbps),
Fast Ethernet circuits (100 Mbps), Gigabit Ethernet (1 Gbps), and 10 Gigabit Ethernet (10
Gbps). In order to achieve these higher transport speeds over city-wide distances, use of a very
high bandwidth media is required – specifically, singlemode fiber optic cabling.
Bandwidth
Bandwidth is the information-carrying capability of any media type, including copper cables and
fiber optic cables. Within the industry, singlemode fiber optic cabling is recognized as having
infinite bandwidth – that is, there is no effective limit on how fast the data can be transported via
this medium. Once emerging technologies are ratified by the industry standards organizations,
the very same singlemode fiber optic cabling can be utilized to provide 40Gbps, 100Gbps, and

City of Ontario, California
Fiber Optic Master Plan
13 | P a g e
even higher transport speeds, demonstrating excellent value as a high-bandwidth infrastructure
asset.
Infrastructure Locations
Fiber
The CITY’s current and proposed network configurations are made possible thru the
interconnection of LAN (Local Area Network) and WAN (Wide Area Network) resources. At
present, the CITY is dependent upon WAN resources that are rented / leased from service
providers, and have a specific maximum capacity for data transmission – the monthly recurring
costs are directly relative to the network speeds that are delivered. When the new network of
CITY-owned assets is deployed, the monthly recurring costs to WAN service providers will be
greatly reduced and the network speeds within the CITY’s new fiber infrastructure will be
significantly increased, in many instances by nearly two hundred-fold.
The new network assets are comprised of active network components that will be deployed with
consideration to redundancy and reliability – the use of fault-tolerant design criteria will insure
maximum uptime and performance for CITY operations. This carrier-class network uses a ring
topology intended to mitigate the effects of the failure of any individual piece of equipment or
fiber outage that could result from a “dig up.” This network will also support passive optical
network (PON) components at the edge, if the CITY should choose to implement them.
Description of the actual fiber routes will require use of some terminology and networking terms
that will be defined here. First, the fiber infrastructure routes have a varying number of fiber
strands that are dependent upon their function – Primary Rings and Secondary Rings utilize
fiber counts including 2 cables of 432 fibers each, one 432 fiber cable, and one 288 fiber cable.
These Primary / Secondary rings provide redundant Transport capability between the CITY’s
Points Of Presence (POPs), and are initially configured to provide traffic rates at 10 Gigabits per
second, or roughly 10 billion bits of data per second.
The CITY Fiber Optic Network has two distinctly separate topologies – Transport and Access
Layers. The Transport Layer is the 10 Gigabits per second interconnection between the POPs,
and the Access Layer interconnections are 1 Gigabit per second links from the POPs out to the
individual CITY facilities / interconnected assets (traffic signals, wells, etc.).
POPs & Electronics
The deployment plan for the CITY POPs provides for four locations where Primary and
Secondary rings meet with the active network equipment to provide this 10 Gigabit transport
function – two each in Old Model Colony (OMC) and New Model Colony (NMC). The existing
City Hall Data Center will be described as the OMC West POP location on all system maps and
documents prepared as a part of the Fiber Optic Master Plan.

City of Ontario, California
Fiber Optic Master Plan
14 | P a g e
Figure 2 – City of Ontario Facilities Map (OMC & NMC)
Within each of the four proposed POPs, there will be two layers of active network electronics
deployed: the TRANSPORT layer provides POP to POP traffic rates at 10 Gbps, and ACCESS
layer connectivity to individual sites / locations / users, initially configured to provide traffic rates
at 1 Gbps, or approximately 1 billion bits of data per second.
While the active Transport and Access network components are currently configured for 10
Gbps / 1 Gbps traffic rates, it is noteworthy that this capacity exists ONLY within the active
components and not the fiber infrastructure itself. The fiber has virtually limitless bandwidth
and, with future replacement of the active network components, could readily support higher
traffic rates including 40 Gbps and 100 Gbps. Additional discussion about the planned active
electronic components will follow the detailed review of the fiber optic infrastructure.
IDCS has prepared / provided a great amount of graphical representation of the Primary and
Secondary Rings in the proposed system maps that can be found in detail within the master
plan’s appendices. The condensed maps and map legends depicted below describe the route
footage of the various Primary, Secondary Rings, and Laterals within the OMC and NMC
service areas.

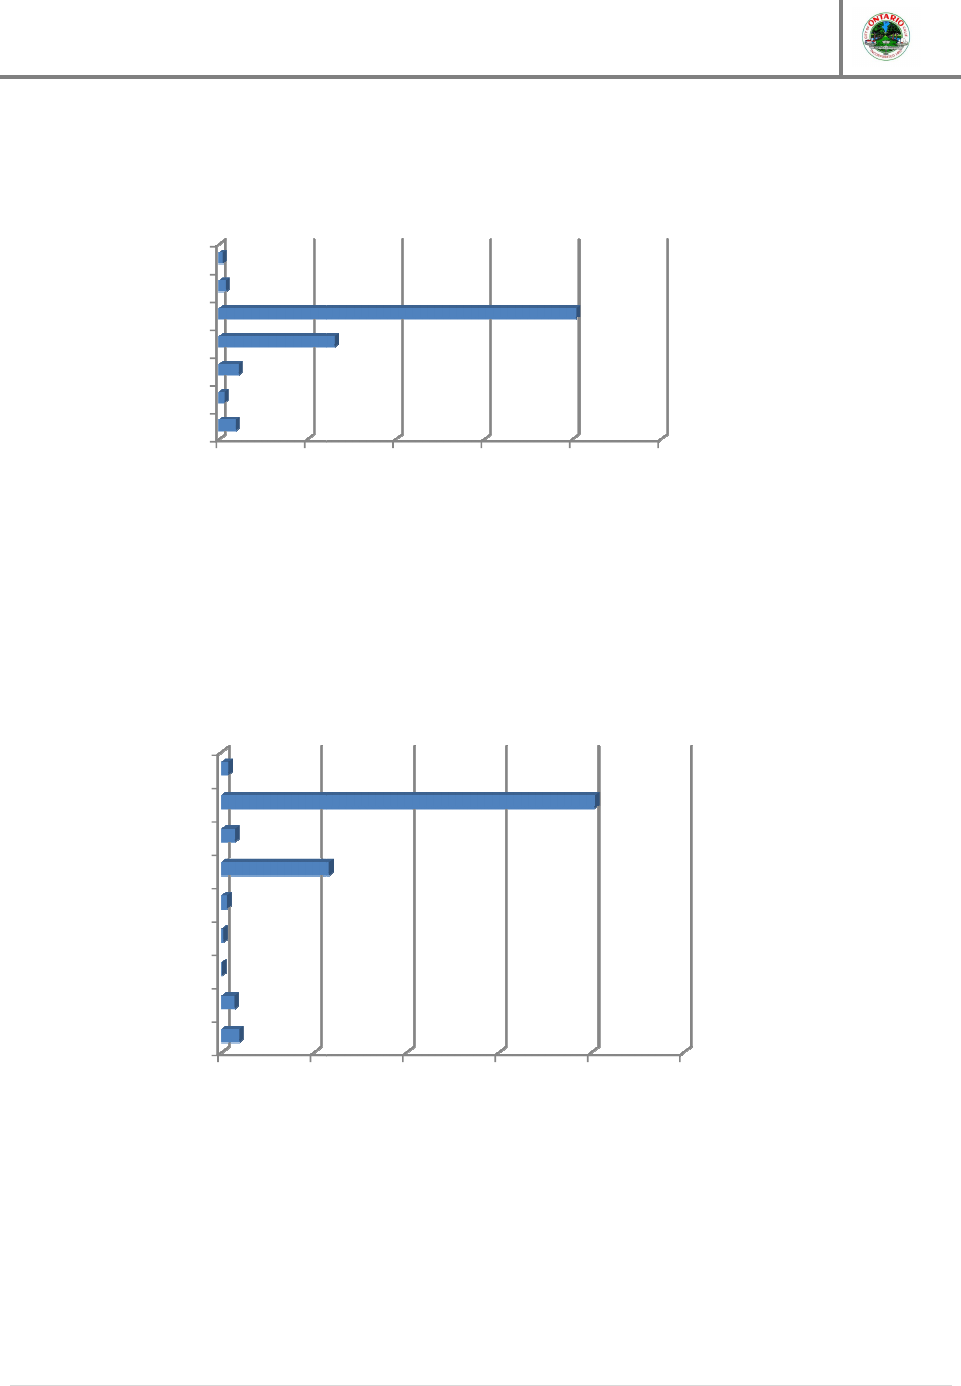
Figure 3 – OMC
Ring and Lateral F
City of Ontario, California
Fiber Optic Master Plan
Ring and Lateral F
iber Optic Cabling
City of Ontario, California
Fiber Optic Master Plan
15 | P a g e

0
10,000
(2)432 / Primary Ring
432 / Primary Ring
432 / Secondary Ring
Fiber Count - Application
OMC Transport Layer Ring Footage
0
50,000
12
36
96
144
3,597
17,751
Fiber Count
OMC Access Layer Lateral Footage
City of Ontario, California
Fiber Optic Master Plan
10,000
20,000 30,000 40,000 50,000
13,232
44,587
41,071
Length in Feet
OMC Transport Layer Ring Footage
50,000
100,000 150,000
129,854
140,362
Length in Feet
OMC Access Layer Lateral Footage
City of Ontario, California
Fiber Optic Master Plan
16 | P a g e

Figure 4 – NMC
Ring and Lateral Footages
0 20,000
288
432
(2)432
7,967
Fiber Count
NMC Transport Layer Ring Footage
City of Ontario, California
Fiber Optic Master Plan
Ring and Lateral Footages
40,000 60,000 80,000
43,670
70,905
Length in Feet
NMC Transport Layer Ring Footage
City of Ontario, California
Fiber Optic Master Plan
17 | P a g e

The proposed fiber infrastructure from the POPs
the Access network includes fiber cables referred to as Laterals, and they contain a mix of the
following fiber strand counts: 144, 96, 72, 36, and 12. This 1
primary level of service provided
directly relevant in comparison to the rented / leased carrier circuits currently used to support
CITY WAN traffic.
As before with the Primary
and Secondary Rings, IDCS also provided detailed route maps that
depict the Lateral routes and their respective fiber strand counts. As an alternative view of that
same data, IDCS will describe those proposed Laterals in separate charts belo
and NMC service areas.
The prior maps
within this section only provide data about what the completed system would
look like if it was already built. Clearly, there is a time component that would be relevant to the
construction and deployme
nt of this new CITY
to also view the plan to bring these systems on
infrastructures will also be presented with the order in which they are conceptually plan
installation by project phase.
0 20,000
40,000
12
36
72
96
144
1,938
25,918
3,882
Fiber Count
NMC Access Layer Lateral Footage
City of Ontario, California
Fiber Optic Master Plan
The proposed fiber infrastructure from the POPs
out to the various sites / locations / users on
the Access network includes fiber cables referred to as Laterals, and they contain a mix of the
following fiber strand counts: 144, 96, 72, 36, and 12. This 1
Gbps
Access layer traffic is the
primary level of service provided
to the CITY’s network customers
(City Facilities)
directly relevant in comparison to the rented / leased carrier circuits currently used to support
and Secondary Rings, IDCS also provided detailed route maps that
depict the Lateral routes and their respective fiber strand counts. As an alternative view of that
same data, IDCS will describe those proposed Laterals in separate charts belo
within this section only provide data about what the completed system would
look like if it was already built. Clearly, there is a time component that would be relevant to the
nt of this new CITY
-owned infrastructure,
so it would be appropriate
to also view the plan to bring these systems on
-line. In the maps
that follow, the various fiber
infrastructures will also be presented with the order in which they are conceptually plan
40,000
60,000 80,000 100,000
83,712
67,916
25,918
Length in Feet
NMC Access Layer Lateral Footage
City of Ontario, California
Fiber Optic Master Plan
18 | P a g e
out to the various sites / locations / users on
the Access network includes fiber cables referred to as Laterals, and they contain a mix of the
Access layer traffic is the
(City Facilities)
, and would be
directly relevant in comparison to the rented / leased carrier circuits currently used to support
and Secondary Rings, IDCS also provided detailed route maps that
depict the Lateral routes and their respective fiber strand counts. As an alternative view of that
same data, IDCS will describe those proposed Laterals in separate charts belo
w for the OMC
within this section only provide data about what the completed system would
look like if it was already built. Clearly, there is a time component that would be relevant to the
so it would be appropriate
that follow, the various fiber
infrastructures will also be presented with the order in which they are conceptually plan
ned for
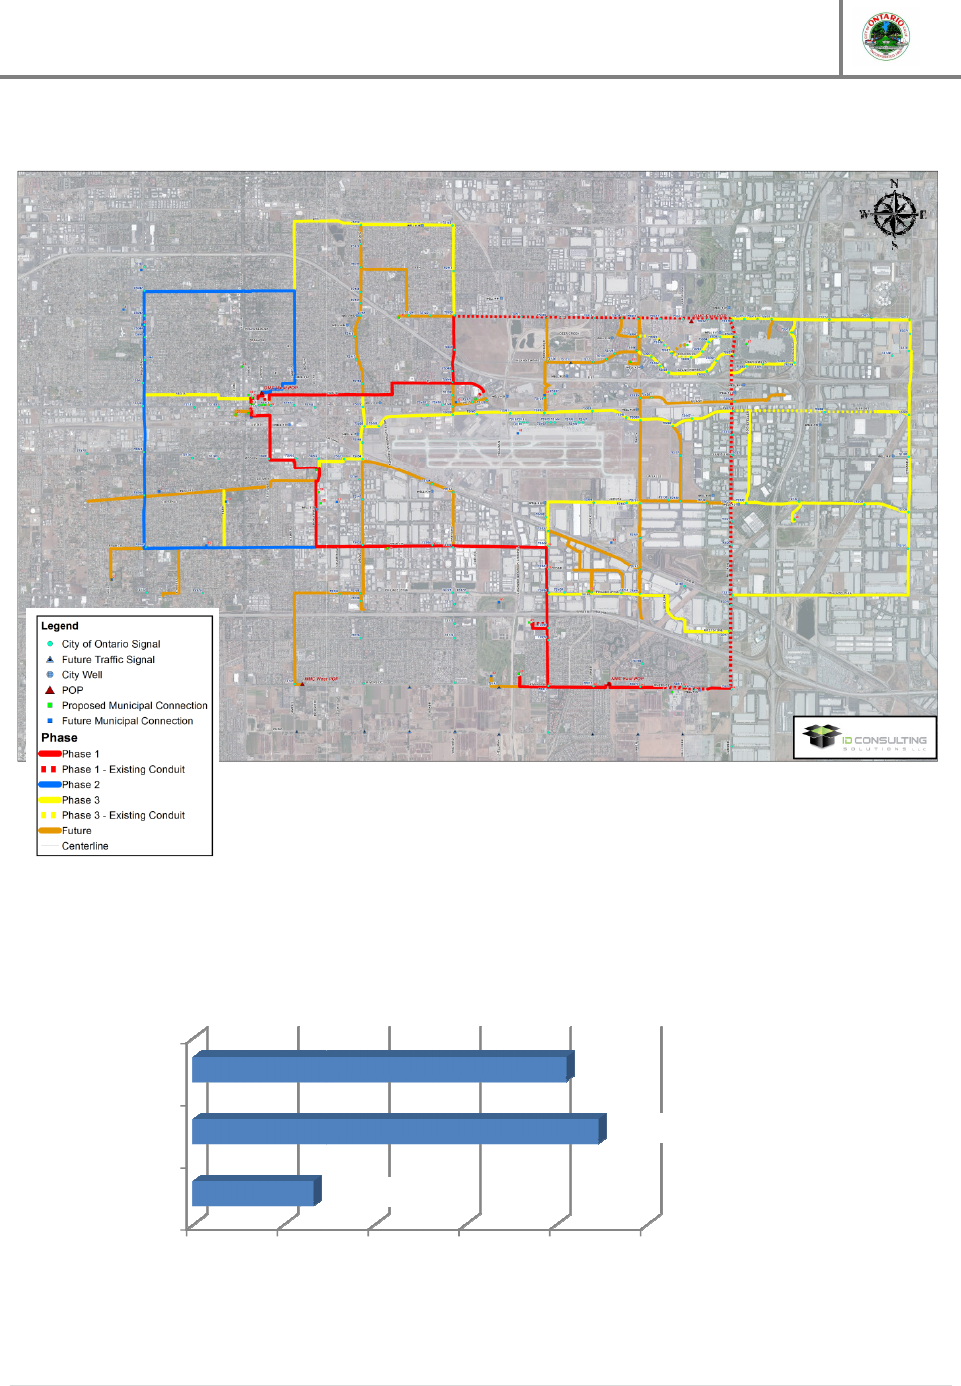
Figure 5 – OMC
Implementation Phases
0 10,000
(2)432 / 1
432 / 1
432 / 2
Fiber Count / Phase
OMC Transport Layer
Ring Footage By Phase
City of Ontario, California
Fiber Optic Master Plan
Implementation Phases
and Footages
20,000 30,000 40,000 50,000
13,232
44,587
41,071
Length in Feet
OMC Transport Layer
Ring Footage By Phase
City of Ontario, California
Fiber Optic Master Plan
19 | P a g e

NOTE: Information about phasing of backbone construction in
to the uncertain timing of future developments.
In order to understand the fiber count within
count and footages within the OMC and NMC.
Figure 6 –
OMC Fiber Size and Footages
Also, within the OMC areas, a significant amount of existing CITY
as a cost-
effective resource for installation of fiber optic infrastructure.
City of Ontario, California
Fiber Optic Master Plan
NOTE: Information about phasing of backbone construction in
NMC is
difficult to
to the uncertain timing of future developments.
In order to understand the fiber count within
the network, the following maps depict the fiber
count and footages within the OMC and NMC.
OMC Fiber Size and Footages
Also, within the OMC areas, a significant amount of existing CITY
-
owned conduit can be used
effective resource for installation of fiber optic infrastructure.
City of Ontario, California
Fiber Optic Master Plan
20 | P a g e
difficult to
forecast, due
the network, the following maps depict the fiber
owned conduit can be used
0
10,000
EMPTY
Existing 6 FOC
12
36
432
432/48
(2)432
1,897
622
2,200
788
440
Fiber Count
OMC Service Area
Fiber Footage in Existing Conduit
0
10,000
Empty / Empty
12 / 1
12 / 3
12 / Existing
12 / Future
36 / 3
36 / Future
432 / 1
432/48 / 1
1,897
1,389
61
194
556
1,428
693
Fiber Count / Phase
OMC Service Area Fiber Footage
Existing Conduit by Phase
City of Ontario, California
Fiber Optic Master Plan
10,000
20,000 30,000 40,000 50,000
13,057
40,337
Length in Feet
OMC Service Area
Fiber Footage in Existing Conduit
10,000
20,000 30,000 40,000 50,000
11,629
40,337
Length in Feet
OMC Service Area Fiber Footage
Existing Conduit by Phase
City of Ontario, California
Fiber Optic Master Plan
21 | P a g e

Figure 7 –
NMC Fiber Size and Footages
0 20,000
40,000
12
36
72
96
144
1,938
28,642
3,882
Fiber Count
NMC Access Layer Lateral Footage
All Future Phase
City of Ontario, California
Fiber Optic Master Plan
NMC Fiber Size and Footages
40,000
60,000 80,000 100,000
91,087
60,146
28,642
Length in Feet
NMC Access Layer Lateral Footage
All Future Phase
City of Ontario, California
Fiber Optic Master Plan
22 | P a g e

City of Ontario, California
Fiber Optic Master Plan
23 | P a g e
Implementation Phasing Plan
Overview
As stated in the Conceptual Layout & Needs Assessment Memorandum, it is recommended that
the Primary and Secondary Rings in the OMC be built. This will enable the key targets
throughout the CITY to be interconnected as the foundation for the CITY to expand the fiber
optic communication network. Expansion would be considered with requests from economic
development, street improvements (overlays), CIP projects, water upgrades/replacement, sewer
upgrades and utility transitions or upgrades.
Within Appendix A, there are detailed descriptions of the system interconnections and project
phases for OMC and NMC. However, the descriptions of the Primary Ring, Secondary Ring
and the Laterals will be consistent between the two. As NMC is built-out, it will have the same
infrastructure characteristics as the CITY Fiber Optic Network in OMC.
Also, the OMC portion of the network has been developed in a phased approached and a
description of each is included. Phases are as follows:
• Primary Ring and Key Target Laterals – Phase I
• Secondary Ring and Key Target Laterals – Phase II
• Other Laterals – Future Phase
Due to the unknown timing of NMC development locations, a fully-phased representation of
Laterals cannot be developed at this time. However, various key targets have been identified
and maps have been developed to illustrate where the Primary Ring and Secondary Ring would
be in relation to those targets upon complete build-out.
Naming Conventions
(from Conceptual Layout of Needed Infrastructure document):
Primary Ring (PR) - The Primary Ring (PR) will act as the transport network for City Services,
interconnecting key City targets to the four primary facility locations at City Hall, Riverside Facility,
the City Arena vicinity (OMC East), and Centennial Park.
Secondary Ring (SR) - The Secondary Ring (SR) will act as the transport along the West side of the
City (OMC) originating and terminating at City Hall through diverse conduit entries.
Laterals - The Lateral routes will act as the feeder routes in and out of the primary and secondary
rings from interconnection points to key and future targets.
CIP Projects – These are CITY projects that provide open trenches for other CITY systems, where
communication ducts can be placed, with a minor adjustment to the existing excavation (see detailed
drawing on page 64).

City of Ontario, California
Fiber Optic Master Plan
24 | P a g e
Old Model Colony (OMC) & New Model Colony (NMC)
Primary Ring – Phase I
The Primary Ring (PR) will act as the transport network for CITY Services, interconnecting three
of the four primary POP facility locations at City Hall, Riverside Facility, and the City Arena
vicinity. Upon deployment of the PR conduit system, as defined in the OMC fiber exhibit maps,
installation of a 432 count fiber optic cable (single jacket with 24 count tight buffer tubes) will
provide distribution through planned laterals and along the Primary Ring defined in the OMC
and NMC exhibit maps provided herein.
The typical primary Ring cross-section will consist of the following:
One (1) - 2” HDPE SDR-11 (Smoothwall) roll pipe (Orange)
Two (2) - 7 Way MicroDuct (Duraline) – 16mm Tubes
36”x60” Composite Polyconcrete Handhole (HH-4)
The PR method of installation in the OMC will predominately be accomplished through
horizontal directional drilling, pneumatic pushing and the preferred method, trenching.
Directional drilling will require pothole locating at road crossings to verify the depth of existing
utilities as required and back reaming based on the conduit configuration, typically 6” in
diameter. Trenching will be identified in locations where street cuts could exist, along streets
without moratoriums and at non-hard surface areas.
Exceptions: The Primary Ring will consist of the typical cross section outlined in OMC & NMC
Conduit Exhibit; however, a section from City Hall to E. Francis Street (OMC) and Hellman
Avenue from Riverside Drive to Merrill Avenue (NMC) will require an additional 2” conduit
defined as PB + (1) 2”. The additional 2” will provide a path for the Secondary Ring route from
City Hall to the West in the OMC and will provide as the pathway for the two Primary Rings in
the NMC.
Secondary Ring – Phase II
The Secondary Ring (SR) will act as the transport along the West side of the CITY (OMC)
originating and terminating at City Hall through diverse conduit entries. In both the NMC and
OMC, similar to the PR, the SR will support the interconnection of key targets, will be populated
with up to 432 count fiber optic cable, and be used to extend along the proposed lateral route in
the OMC and NMC Exhibit Map. As it is illustrated in the NMC Exhibit Map, the SR will play a
significant role in the fiber design, minimizing stranded fibers and insuring there is a ring
topology throughout the PR and SR infrastructure architecture.

City of Ontario, California
Fiber Optic Master Plan
25 | P a g e
The typical Secondary Ring cross-section for both OMC and NMC will consist of the following:
One (1) - 2” HDPE SDR-11 (Smoothwall) roll pipe (Orange)
One (1) - 7 Way MicroDuct (Duraline) – 16mm Tubes
36”x60” Composite Polyconcrete Handhole (HH-4)
The SR will be installed similar to the Primary Ring, through horizontal directional drilling,
pushing and trenching as required.
Laterals (Future Phases)
The Lateral routes will act as the feeder routes in and out of the Primary and Secondary Rings
from interconnection points to key targets and future targets. These routes will be installed as
New Build, Joint Build or in Existing Duct. Unlike PR and SR, this will be populated with a small
distribution fiber optic cable that will be sized appropriately based on area, targets and future
needs.
• New Build - The typical method of placement will be directional boring and limited trenching,
primarily at tie-in locations. This cross-section will consist of the following:
One (1) - 2” HDPE SDR-11(Smoothwall) roll pipe (Orange)
One (1) - 7 Way MicroDuct (Duraline) – 16mm Tubes
30”x48” Composite Polyconcrete Handhole (HH-3)
• CIP Joint Build - The typical method of placement will likely be trenching with the CITY’s
communications duct being placed on a stepped shelf within the main trench. This cross-
section will consist of the following:
One (1) - 2” HDPE SDR-11 (Smoothwall) roll pipe (Orange)
One (1) - 7 Way MicroDuct (Duraline) – 16mm Tubes
30”x48” Composite Polyconcrete Handhole (HH-3)
• Existing Duct (Traffic Department) – The typical method of placement will be installation
of a new fiber optic cable and micro ducts through existing CITY owned duct. Depending on
the size of this duct will dictate the quantity(s), as defined below:
• 1” Exist. Duct: One (1) – New fiber optic cable
• 1-1/2” Exist. Duct: Two (2) Micro Duct – 16mm, One (1) New fiber optic cable
• 2” Exist. Duct: Four (4) Micro Duct – 16mm, One (1) New fiber optic cable

City of Ontario, California
Fiber Optic Master Plan
26 | P a g e
Building / POP Interconnect
The Primary and Secondary Ring routes will terminate at 4 key building Point of Presence
(POP) locations. The following locations will support both the physical fiber termination, cross-
connections and transport switch / aggregation switch equipment for the CITY. The four (4)
locations are defined as:
OMC WEST - City Hall
OMC EAST - City Arena Vicinity
NMC EAST - Riverside Facility
NMC WEST - Centennial Park Vicinity (Future)
The NMC WEST POP is to support expansion within NMC and the timing for its construction is
dependent on build-out of the NMC network. As such, the budget value to construct NMC
WEST is defined within the budget information to follow, but the actual construction of NMC
WEST is NOT INCLUDED within either Phase 1 or Phase 2 of this project planning document.
OMC WEST - City Hall (Existing Facility)
Portions of the connectivity project illustrated below include placing conduit from the Northwest
corner at the intersection of N. Lemon Ave and B Street to the Northeast corner at the
intersection of Plum Avenue and B Street. The conduit will then head North and East (as
depicted), ultimately entering City Hall from the East along the West side of Cherry Avenue.
This will allow for diverse entrances to the POP location thus resulting in a carrier-class quality
network.

City of Ontario, California
Fiber Optic Master Plan
27 | P a g e
Figure 8 - OMC WEST - City Hall (Existing Facility)
NMC EAST - Riverside Facility (Existing Facility)
The Riverside Facility is an existing facility and was originally selected for its location and
proximity to NMC and provides a solid location for redundancy and connectivity to existing
CITY-owned conduit. The illustration below is a high-level diagram showing what would be
constructed. A new generator will be installed, along with a caged environment for the CITY
Network and Co-Location (COLO) facilities that are available for entities outside of the CITY
Network.
O

Figure 9 - NMC EAST
(Riverside Facility)
City of Ontario, California
Fiber Optic Master Plan
(Riverside Facility)
- Facility Layout Plan
City of Ontario, California
Fiber Optic Master Plan
28 | P a g e

Figure 10 - NMC EAST
(Riverside Facility)
OMC EAST (City Arena Vicinity) / NMC WEST (Centennial Park
Precast Shelters
Final locations for OMC EAST / NMC WEST
OMC EAST
would be constructed in close proximity to the backbone network in OMC. The
NMC WEST is
to support expansion within
build-out of the NMC network.
within the budget information to follow, but the actual construction of NMC WEST is
INCLUDED
within either Phase 1 or Phase 2 of this project planning document.
At each location, a precast
concrete s
Initially, due to construction
cost and
used, backup power
would consist of
process, identifying adequate space for a generator
prudent as
additional supporting infrastructure.
City of Ontario, California
Fiber Optic Master Plan
(Riverside Facility)
- Site Layout Plan
OMC EAST (City Arena Vicinity) / NMC WEST (Centennial Park
Final locations for OMC EAST / NMC WEST
have not yet been determined. Important to note,
would be constructed in close proximity to the backbone network in OMC. The
to support expansion within
NMC and the timing
for construction
As such, the budget value to construct NMC WEST is defined
within the budget information to follow, but the actual construction of NMC WEST is
within either Phase 1 or Phase 2 of this project planning document.
concrete s
helter would be engineered, erected and configured.
cost and
the initial minimal electrical load of the network electronics
would consist of
a battery bank only
. However, during the engineering
process, identifying adequate space for a generator
/ transfer switch / fuel tank would be
additional supporting infrastructure.
City of Ontario, California
Fiber Optic Master Plan
29 | P a g e
Vicinity)
have not yet been determined. Important to note,
would be constructed in close proximity to the backbone network in OMC. The
for construction
is dependent on
As such, the budget value to construct NMC WEST is defined
within the budget information to follow, but the actual construction of NMC WEST is
NOT
helter would be engineered, erected and configured.
the initial minimal electrical load of the network electronics
. However, during the engineering
/ transfer switch / fuel tank would be

Figure 11 –
OMC EAST / NMC WEST Typical Layout
Existing Duct Utilization
The CITY’s
existing communication and traffic conduit will be utilized when required. In the
illustration below, the FIBER represets a maximum fiber count of 288 count and each 16mm MD
(Micro-
Duct) will support up to 144 fiber count. Specific fiber count is determ
and communication network needs. A majority of the exisitng ducts currently provide a copper
communication connection to surrounding traffic
cabinets. In order to utilize the duct, the copper cabl
to installed near the cabinet for splicing purposes and some conduit construction will be required
to tie in the cabinet conduit to the new handhole. Once the handhole is installed, the conduit
sweeps are in place, a pre-
terminated fiber optic pigtail will be placed and spliced into the fiber
backbone or lateral.
City of Ontario, California
Fiber Optic Master Plan
OMC EAST / NMC WEST Typical Layout
existing communication and traffic conduit will be utilized when required. In the
illustration below, the FIBER represets a maximum fiber count of 288 count and each 16mm MD
Duct) will support up to 144 fiber count. Specific fiber count is determ
and communication network needs. A majority of the exisitng ducts currently provide a copper
communication connection to surrounding traffic
signals that traverses
through the traffic
cabinets. In order to utilize the duct, the copper cabl
e will have to removed, handholes will have
to installed near the cabinet for splicing purposes and some conduit construction will be required
to tie in the cabinet conduit to the new handhole. Once the handhole is installed, the conduit
terminated fiber optic pigtail will be placed and spliced into the fiber
City of Ontario, California
Fiber Optic Master Plan
30 | P a g e
existing communication and traffic conduit will be utilized when required. In the
illustration below, the FIBER represets a maximum fiber count of 288 count and each 16mm MD
Duct) will support up to 144 fiber count. Specific fiber count is determ
ined by location
and communication network needs. A majority of the exisitng ducts currently provide a copper
through the traffic
e will have to removed, handholes will have
to installed near the cabinet for splicing purposes and some conduit construction will be required
to tie in the cabinet conduit to the new handhole. Once the handhole is installed, the conduit
terminated fiber optic pigtail will be placed and spliced into the fiber

Figure 12 –
Existing Conduit Utilization
Capacity Analysis
Current
As reported within the Technical Memorandum based upon data acquired from the
is a wide spectrum of digital and analog carrier services currently supporting
Excerpted from that report, please refer to the following table:
Table 1 –
Existing Communication Circuit Counts
E
XISTING COMM
Circuit Type
Ethernet 100Mbps
Ethernet 50 / 25 Mbps
Ethernet 5Mbps
T-1
ISDN
Digital Subscriber Line
Frame Relay
Voice Grade
Frame Relay
TOTAL CIRCUITS / Quantity / Mbps
* Estimated data rates.
All available circuit data was
inventoried in
CITY for the circuits listed above. While only 60 of the above 97 circuits were available with
detailed pricing information,
the
City of Ontario, California
Fiber Optic Master Plan
Existing Conduit Utilization
As reported within the Technical Memorandum based upon data acquired from the
is a wide spectrum of digital and analog carrier services currently supporting
CITY
Excerpted from that report, please refer to the following table:
Existing Communication Circuit Counts
XISTING COMM
UNICATION CIRCUIT COUNTS
Size Qty.
Ethernet 100Mbps
100 Mbps 5
Ethernet 50 / 25 Mbps
50 / 25 Mbps 1
Ethernet 5Mbps
5 Mbps 1
1.544Mbps 32
24 x 64Kbps 4
Digital Subscriber Line
* 1 Mbps 12
* 256Kbps 3
64Kbps 38
* 56 Kbps 1
TOTAL CIRCUITS / Quantity / Mbps
97
inventoried in
an
effort to identify monthly recurring costs to the
CITY for the circuits listed above. While only 60 of the above 97 circuits were available with
the
estimated costs from the data in hand
City of Ontario, California
Fiber Optic Master Plan
31 | P a g e
As reported within the Technical Memorandum based upon data acquired from the
CITY, there
CITY
operations.
Total IP
500
50
5
49.408
6.16
12
0.75
0.5
-
623.818
effort to identify monthly recurring costs to the
CITY for the circuits listed above. While only 60 of the above 97 circuits were available with
estimated costs from the data in hand
was utilized to

City of Ontario, California
Fiber Optic Master Plan
32 | P a g e
extrapolate the monthly expense. From a review of actual costs, the following monthly cost
estimate was used to establish the total monthly recurring cost for WAN circuits:
Table 2 – Estimated Communication Circuit Expense Per Month
Estimated
Communication Circuit Expense
Ethernet 100Mbps 100 Mbps $ 1,700
Ethernet 50 / 25 Mbps 50 / 25 Mbps $ 1,000
Ethernet 5Mbps 5 Mbps $ 750
T-1 1.544Mbps $ 300
ISDN 24 x 64Kbps $ 300
Digital Subscriber Line * 1 Mbps $ 40
Frame Relay * 256Kbps $ 200
Voice Grade 64Kbps $ 30
Frame Relay * 56 Kbps $ 60
* Estimated data rates.
Future
By combining the actual data acquired from the CITY, and with the above estimated monthly
expenses, the CITY’s monthly recurring costs for carrier circuits is approximately $ 22,400 per
month. A very significant portion of these funds would be available each month to support a
fiber optic network, representing in excess of $ 268,000 per year.
A replacement system would include the entirety of the fiber optic infrastructure and active
network components as described herein, plus the addition of carrier services for
communication outside the new system. At present, a significant portion of the traffic between
CITY users require both outbound and inbound carrier circuits for interdepartmental
communication. If integrated onto a CITY-owned system, the nearly 100 circuits in use today
could be replaced with a very small number of high-speed carrier circuits to provide voice, data,
and even video communication capabilities.
Preliminary pricing of competitive carrier service offerings, indicates that one 300Mbps IP
Internet Drain service, would represent a monthly recurring cost of approximately $ 2,500. As
prepared within a May 2012 Cost Savings Breakdown spreadsheet provided by the CITY, there
was an expectation that there would be an initial / ongoing requirement for legacy telco circuits
that would represent an ongoing monthly cost of approximately $ 3,840. Over time, a majority
of traffic requiring legacy telco circuits can be migrated over to the new fiber optic infrastructure,
which would provide additional potential savings.

Figure 13 –
Carrier Circuit Usage / Monthly Charges
In contrast to the current monthly recurring charges, the
a reduction in monthly circuit charges in a range between $ 14,560 (after Phase 1) and $ 16,060
(after Phase 2),
or between $ 174,720 and $ 192,720
additional legacy telco circuits can be migrated onto the new network, the monthly savings could
grow by an additional $ 3,840, which represents an additional $ 46,080 annual sav
Apart from the financial effects of this new system, the CITY’s operations will be significantly
enhanced by moving from the current / legacy circuits to a 1 Gbps / 10 Gbps fiber optic network.
Direct comparison of these two would be
the performance of the Wright brothers Flyer against the modern
F-22
Raptor. In the effort to better demonstrate the value of the
proposed 1Gbps connections to CITY operations in “like
performance terms, use of equal circuits provided
also been included for cost /
benefit consideration
In the Figure 14 graph that follows,
circuit monthly costs, [2] the monthly cost to apply 1 Gbps connectivity for t
the CITY Fiber Optic Network
connectivity to all Phase 1 + 2 sites in the CITY Fiber Optic Network. This illustrates not only
the huge leap in system
performance
installed today (excluding one-
time installation charges).
$- $5,000
$10,000
Phase 2
Phase 1
Current
$3,840
$5,340
$22,400
$2,500
$2,500
Carrier Circuit Usage /
Monthly Charges
City of Ontario, California
Fiber Optic Master Plan
Carrier Circuit Usage / Monthly Charges
In contrast to the current monthly recurring charges, the
CITY
should be in a position to realize
a reduction in monthly circuit charges in a range between $ 14,560 (after Phase 1) and $ 16,060
or between $ 174,720 and $ 192,720
respectively,
on an annualized basis. As
additional legacy telco circuits can be migrated onto the new network, the monthly savings could
grow by an additional $ 3,840, which represents an additional $ 46,080 annual sav
Apart from the financial effects of this new system, the CITY’s operations will be significantly
enhanced by moving from the current / legacy circuits to a 1 Gbps / 10 Gbps fiber optic network.
Direct comparison of these two would be
similar to
comparing
the performance of the Wright brothers Flyer against the modern
Raptor. In the effort to better demonstrate the value of the
proposed 1Gbps connections to CITY operations in “like
-for-
like”
performance terms, use of equal circuits provided
by competitive carriers
benefit consideration
.
In the Figure 14 graph that follows,
a comparison is provided that shows: [1] the current leased
circuit monthly costs, [2] the monthly cost to apply 1 Gbps connectivity for t
he sites included in
the CITY Fiber Optic Network
–
Phase 1, and [3] the monthly costs to provide 1 Gbps
connectivity to all Phase 1 + 2 sites in the CITY Fiber Optic Network. This illustrates not only
performance
, but also sets a
baseline cost if these leased circuits were
time installation charges).
$10,000
$15,000 $20,000 $25,000
$22,400
$0
$16,060
$14,560
Carrier Circuit Usage /
Monthly Charges
Legacy Telco
IP Drain
Savings
City of Ontario, California
Fiber Optic Master Plan
33 | P a g e
should be in a position to realize
a reduction in monthly circuit charges in a range between $ 14,560 (after Phase 1) and $ 16,060
on an annualized basis. As
additional legacy telco circuits can be migrated onto the new network, the monthly savings could
grow by an additional $ 3,840, which represents an additional $ 46,080 annual sav
ings.
Apart from the financial effects of this new system, the CITY’s operations will be significantly
enhanced by moving from the current / legacy circuits to a 1 Gbps / 10 Gbps fiber optic network.
comparing
the performance of the Wright brothers Flyer against the modern
Raptor. In the effort to better demonstrate the value of the
like”
by competitive carriers
has
a comparison is provided that shows: [1] the current leased
he sites included in
Phase 1, and [3] the monthly costs to provide 1 Gbps
connectivity to all Phase 1 + 2 sites in the CITY Fiber Optic Network. This illustrates not only
baseline cost if these leased circuits were

Figure 14 –
Adding 1 Gbps Leased Circuits / Monthly Charges
The monthly charges represented in
w
hich are present in the current network: Legacy Telco and IP
charges required to bring the current system up to 1 Gbps capabilities consist of “Connection
Costs” (flat rate “empty” connection “pipes”
(bandwidth that ranges from 100 Mbps down to 15 Mbps per circuit, which is a close
approximation to the current configuration in Table 2
hose).
It is dramatically apparent that the
“like-for-like” basis
with leased carrier circuits will be a useful benchmark
deploy this
CITY Fiber Optic Network.
By migrating a significant portion of CITY traffic onto the
infrastructure, there would not only be an incredible gain in speed and efficiency, but also a
dramatic reduction in monthly costs
“apples for apples.” If the CITY wishes to compare the relative value of this proposed network
architecture, it would be appropriate to calculate the current cost to purchase that same level of
service from available service providers.
existing CITY assets that already represent some ongoing monthly expense, specifically the
locations to be included in Phases 1 and 2.
The CITY currently employs 9 different circuit types / multiple data
“brick-and-
mortar” buildings that house CITY departments, traffic signals, and other low speed
data devices such as wells. To establish a reasonable comparison, we have applied current 1
Gbps connection charges and circuit charg
•
Current 100Mbps Building Locations
$- $20,000
Add Phase 2
Sites
Add Phase 1
Sites
Currently
Leased
$3,840
$5,340
$20,900
$4,000
$4,000
$1,500
$47,600
Add 1Gbps Leased Circuits /
$22,400
City of Ontario, California
Fiber Optic Master Plan
Adding 1 Gbps Leased Circuits / Monthly Charges
The monthly charges represented in
Figure 14
are comprised of several components, two of
hich are present in the current network: Legacy Telco and IP
Internet
Drain. The new carrier
charges required to bring the current system up to 1 Gbps capabilities consist of “Connection
Costs” (flat rate “empty” connection “pipes”
, imagine this as a garden hose
) and “Circuit Costs”
(bandwidth that ranges from 100 Mbps down to 15 Mbps per circuit, which is a close
approximation to the current configuration in Table 2
, think of this as
the water inside the garden
It is dramatically apparent that the
current market value of the proposed
1 Gbps
with leased carrier circuits will be a useful benchmark
against the costs to
CITY Fiber Optic Network.
By migrating a significant portion of CITY traffic onto the
proposed F
iber
infrastructure, there would not only be an incredible gain in speed and efficiency, but also a
dramatic reduction in monthly costs
– but the prior analysis in Figure 14
was not comparing
“apples for apples.” If the CITY wishes to compare the relative value of this proposed network
architecture, it would be appropriate to calculate the current cost to purchase that same level of
service from available service providers.
Obviously, this cost comparison would be limited to
existing CITY assets that already represent some ongoing monthly expense, specifically the
locations to be included in Phases 1 and 2.
The CITY currently employs 9 different circuit types / multiple data
rates that are applied to
mortar” buildings that house CITY departments, traffic signals, and other low speed
data devices such as wells. To establish a reasonable comparison, we have applied current 1
Gbps connection charges and circuit charg
es in these three groupings:
Current 100Mbps Building Locations
–
5 locations @ 100Mbps, including City Hall
$40,000 $60,000 $80,000 $100,000
$58,800
$47,600
$25,125
$21,525
Add 1Gbps Leased Circuits /
Monthly Charges
$78,465
$91,765
$22,400
City of Ontario, California
Fiber Optic Master Plan
34 | P a g e
are comprised of several components, two of
Drain. The new carrier
charges required to bring the current system up to 1 Gbps capabilities consist of “Connection
) and “Circuit Costs”
(bandwidth that ranges from 100 Mbps down to 15 Mbps per circuit, which is a close
the water inside the garden
1 Gbps
network on a
against the costs to
iber
Optic Network
infrastructure, there would not only be an incredible gain in speed and efficiency, but also a
was not comparing
“apples for apples.” If the CITY wishes to compare the relative value of this proposed network
architecture, it would be appropriate to calculate the current cost to purchase that same level of
Obviously, this cost comparison would be limited to
existing CITY assets that already represent some ongoing monthly expense, specifically the
rates that are applied to
mortar” buildings that house CITY departments, traffic signals, and other low speed
data devices such as wells. To establish a reasonable comparison, we have applied current 1
5 locations @ 100Mbps, including City Hall
Legacy Telco
IP Internet
Drain
Connection
Costs
Circuit Costs
$91,765

City of Ontario, California
Fiber Optic Master Plan
35 | P a g e
• Current 50Mbps Building Location – 1 location @ 50Mbps
• All Other Locations – Assumed circuit costs @ 15Mbps each
o Other Buildings, Traffic Signals – Connections After Phase 1 – 59 Locations
o Other Buildings, Traffic Signals – Connections After Phase 2 – 75 Locations
It is rather difficult to accurately forecast one of the cost components, the IP Drain – where the
current / proposed CITY network meets the world outside of the municipal network. It is
sometimes useful to consider past data and trend it forward – and based on ACTUAL CITY IP
Drain circuits installed, the following trend can be observed:
Figure 15 – Historical CITY IP Internet Drain Data Rate (Mbps)
Another view of the CITY’s current aggregate Data Rates can be seen in Table 1, which
currently total at approximately 624 Mbps. There is a caveat in consideration of that data rate,
as it measures both internal and external traffic thru leased carrier circuits – and those circuits
would be substantially replaced by the CITY’s Fiber Optic Network. At any rate, it is safe to
expect significant and continued demand for connection between the CITY’s Fiber Optic
Network and the outside world.
Bandwidth (Demand) Analysis
Within the prior Capacity Analysis section, the CITY’s current Communication Circuit Counts by
circuit type / speed have been detailed. To better illustrate the current systems, review this
simplified graphical illustration of the current CITY network design:
0
50
100
150
200
250
300
350
2002
2003
2004
2005
2006
2007
2008
2009
2010
2011
2012
2013
2014
2015
2016
2017
Data Rate - Mbps
IP Internet Drain Data Rate (Mbps)
Data Rate
(Mbps)
Trending -
Data Rate
(Mbps)

City of Ontario, California
Fiber Optic Master Plan
36 | P a g e
This illustration shows the CITY’s use of legacy telco connections that are quite limiting in speed
to transport the voice, data, and video communication traffic already in place. Also illustrated in
the Capacity Analysis section are the current recurring monthly costs associated with this
network infrastructure, comprised of nearly 100 separate circuits. Admittedly, this plan does not
propose that ALL legacy telco services can or should be eliminated, but a very substantial
portion of them could be migrated over to the proposed fiber optic network infrastructure.
The following graphical illustration shows the Proposed CITY Network in a simplified view:
Figure 16 – Current CITY Network Schematic

City of Ontario, California
Fiber Optic Master Plan
37 | P a g e
Figure 17 – Proposed CITY Network Schematic
In the effort to better demonstrate the impact the CITY Fiber Optic Network would have on tasks
frequently performed by CITY departments, the CITY IT Department was able to define several
different tasks and their relative time to complete that task in network transport time. Here are
four typical users / tasks / data payloads that are common within everyday CITY business:

City of Ontario, California
Fiber Optic Master Plan
38 | P a g e
Back Row - Existing Systems
Front Row - Proposed Fiber Network
Type A
-
Recreation Centers & Remote Sites
Seconds to Complete Typical File Transfer
Front Row -
Proposed Fiber Network
Fractions of One Second
To Complete File
Transfers
Back Row - Existing Circuits
Back Row - Existing Circuits

City of Ontario, California
Fiber Optic Master Plan
39 | P a g e
Back Row - Existing Circuits
109.2
Minutes
54.6
Minutes
Back Row - Existing Circuits
Front Row -
Proposed Fiber Network
Seconds / Fractions
of On Second
To Complete File Transfers

City of Ontario, California
Fiber Optic Master Plan
40 | P a g e
Even to a non-technical observer of graphs Type A thru D above, it is clearly apparent that the
use of a more advanced network infrastructure would dramatically shorten “time on task” for
these typical activities across all CITY department staff. These are measurable, repeatable
gains in efficiency for each individual employee, but beyond the scope of this document to
economically quantify.
Using the “Field Of Dreams” analogy (“If you build it, they will come.”), there would be new and
significant INTANGIBLE BENEFITS that would be available to the CITY – provided that the
technological connectivity was available. Here are a few of the many potential applications that
would be available to the CITY once this Fiber Optic Network is in service:
1. Police Applications – High-speed fiber optic connectivity at traffic signal cabinets will
provide adequate bandwidth for public safety communication needs. This includes
License Plate Recognition (LPR) cameras that can utilize CITY traffic signal poles, high
definition Pan-Tilt-Zoom (PTZ) surveillance cameras at high-traffic intersections,
Dynamic Message Signs (DMS, similar to the Cal Trans “Amber Alert” signs) which can
display graphical images for traffic control and incident management. Current cellular /
Digital Subscriber Line (DSL) options do not provide adequate bandwidth to support the
amount of traffic that is created with these newer technology systems.
These available network connections at traffic signal cabinets would allow Incident
Command vehicles access to the Police network where officers and dispatchers would
have immediate access to CAD, RMS, Cal Photo, Cal Gangs, and other network
dependent applications.
2. Multiple Agencies – Wi-Fi service would be a huge benefit to have throughout the
CITY, but Wi-Fi with sufficient fiber optic backhaul capabilities to a central Internet
gateway is even more important. As more and more CITY departments turn to mobile
devices for real-time work order entry (Code with Accela, Public Works with MyOntario),
the need for a reliable and saturated Wi-Fi network throughout the community is
becoming more necessary. For example, Police and Fire report writing entry can be
started / finished in the field, while the information is fresh in the mind of the reporting
person. Fire’s initiative to implement Electronic Patient Care Reporting (ePCR) depends
on Internet connectivity; therefore, a high-performing Wi-Fi network would enable
quicker dissemination of information between ambulance providers and hospital
facilities.
3. Regional Data Centers / Information Sharing Centers – A fiber optic network would
open the doors for information / computing sharing between neighboring cities, counties,
and states. As the dependency of private / public cloud-based service increases, it
becomes critical to create redundant, resilient, and disaster-ready networks.
Government agencies will need to leverage each other’s technology footprint to share
disaster recovery (DR) resources, draft cooperative agreements for sharing physical and

City of Ontario, California
Fiber Optic Master Plan
41 | P a g e
virtual computing resources across a MAN, and possibly architect backup operational
centers to continue operations under emergency conditions.
System Goals
Initial CITY Municipal Network Goals
The initial objective for the CITY Fiber Optic Network is simple; establish a cost-effective,
secure, fast and reliable fiber optic based communications infrastructure between CITY
facilities. It is intended that the CITY will install this Municipal Fiber Network in the Old Model
Colony (the portion of the CITY north of Riverside Drive) as well as in the New Model Colony
(the portion of the CITY south of Riverside Drive). The CITY’s potential applications and
objectives include, but are not limited to:
• Internal CITY Transport (Fire, Police, Traffic, etc.)
• Centralized Network and Communication Management
• Automatic Meter Reading – Water Services (AMR)
• Traffic Control Systems
• Camera Systems (Municipal Security)
• Wireless Connectivity
• Public Safety
• Minimize Growing Communication Costs
• Economic Development
Implementation Costs
The projected Implementation Costs for the proposed CITY Fiber Optic Network is broken down
into a phased approach, and related subsystems.
The following is a detail of what is included each of the 6 major categories used to budget the
project total cost.

City of Ontario, California
Fiber Optic Master Plan
42 | P a g e
Budget Category Detail
PM, Engineering & Install includes:
Outside Plant (OSP) Design
Network Equipment Installation
Network Operations Center (NOC) Implementation
System Provisioning
Infrastructure includes:
Construction Installation
o Underground Infrastructure Cost
o Fiber System Cost
Core Electronics include:
Network Operation Center (NOC) Core Switches
Access Switches
Switch Optic Interfaces
Facilities include:
Electrical / HVAC / Mechanical Systems
Cable Management
UPS Power Systems
Grounding System
Electronics Racks and Cabinets
Partitions
Building Entrance Links include:
Entrance Facilities
o Trenching, Conduit, Fiber Optic Cabling
Fiber Splicing, Termination, and Testing
Access Switch
o Fiber Optic Interface
Traffic-Water Interconnections include:
Entrance Facilities
o Trenching, Conduit, Handhole, Fiber Optic Cabling
Fiber Splicing, Termination, and Testing
Access Switch (environmentally hardened)
o Fiber Optic Interface

City of Ontario, California
Fiber Optic Master Plan
43 | P a g e
Table 3 – Project Budget Detail – Phase 1
City of Ontario
Fiber Optic Network
Build
Project Budget
Detail
Phase I
PM, Engineering & Install
$580,377
11%
Infrastructure
-
Fiber / Conduit
$3,314,738
65%
Core Electronics
$497,029
10%
Facilities
$336,255
7%
Building Entrance Links
$174,966
3%
Traffic & Water Interconnections
$228,177
4%
Total Fixed Cost
$5,131,542
5.5.13
For a detailed view of the data in Table 3, refer to Appendix B.
11%
65%
10%
7%
3%
4%
City of Ontario
Fiber Optic Network Build - Phase 1
Pie Chart
PM, Engineering & Install
Infrastructure - Fiber /
Conduit
Core Electronics
Facilities
Building Entrance Links
Traffic & Water
Interconnections

City of Ontario, California
Fiber Optic Master Plan
44 | P a g e
Table 4 - Project Budget Detail – Phase 2
City of Ontario Fiber Optic Network Build
Project Budget
Detail
Phase II
PM, Engineering & Install
$130,682
8%
Infrastructure
-
Fiber / Conduit
$1,406,221
84%
Electronics
$34,872
2%
Facilities
$0
0%
Building Entrance Links
$40,377
3
%
Traffic & Water Interconnections
$55,777
3%
Total Fixed Cost $1,667,929
5.5.13
For a detailed view of the data in Table 4, refer to Appendix B.
8%
84%
2%
0%
3%
3%
City of Ontario
Fiber Optic Network Build - Phase 2
Pie Chart
PM, Engineering & Install
Infrastructure - Fiber /
Conduit
Electronics
Facilities
Building Entrance Links
Traffic & Water
Interconnections

City of Ontario, California
Fiber Optic Master Plan
45 | P a g e
Implementation Cost Summary
Table 5 – Phase 1 & 2 Cost Summary
Cost Component Phase 1 Phase 2 TOTAL
PM, Engineering & Install $ 580,377 $ 130,682
$ 711,059
Infrastructure - Fiber / Conduit $ 3,314,738 $ 1,406,221
$ 4,720,959
Core Electronics $ 497,029 $ 34,872
$ 531,901
Facilities $ 336,255 $ - $ 336,255
Building Entrance Links $ 174,966 $ 40,377
$ 215,343
Traffic & Water Interconnections $ 228,177 $ 55,777
$ 283,954
Total Fixed Cost $ 5,131,542 $ 1,667,929
$ 6,799,471
The costs defined in Table 5 above include construction of three of the four POP locations, as
the fourth location (NMC WEST, as referenced on page 27) will be needed at an undetermined
future date, as NMC is developed. As requested by the CITY, here are the budget allowances
for the physical POP facilities (excluding network electronics):
Table 6 – POP Facility Cost Detail
LOCATION
COST
PHASE
DESCRIPTION
OMC WEST – City Hall $ 8,973
1 2
nd
Conduit Entrance
OMC EAST – City Arena Area $ 115,440
1 New Precast Concrete Building
NMC EAST – Riverside Facility $ 190,842
1 Retrofit of Existing Building
NMC WEST – Centennial Park Area $ 115,440
Future New Precast Concrete Building
As a part of prudent fiscal planning, the CITY would need to consider several options for funding
the construction of the CITY fiber optic network, including monthly recurring cost reductions that
would result, cost recovery period for capital assets, and comparison with equal performing
leased circuit options. In tables to follow, the total costs to CITY on an eight-year cumulative
basis are presented for the current system, the proposed CITY Fiber Optic Network, and costs
for leased carrier circuits that would provide like capabilities to the proposed fiber optic network.
In the following cost forecasts, certain recurring expenses are escalated over time across all
examples, and those are detailed below:
• Forecasted Growth Rate Per Year – IP Internet Drain Requirements – 15% Per Year
• CITY Fiber Optic Network Annual Maintenance Costs – 3% of System Construction
Costs

Figure 18 –
Eight Year Cumulative Cost
The costs represented above are for a level of service that would not likely serve the CITY’s
needs over the eight year span of this cost forecast. It is presented as a benchmark to contr
the new CITY
fiber optic network
1
2
$268,800
$540,300
Cumulative Cost - in Million $
Cumulative Cost
City of Ontario, California
Fiber Optic Master Plan
Eight Year Cumulative Cost
– Current Systems
The costs represented above are for a level of service that would not likely serve the CITY’s
needs over the eight year span of this cost forecast. It is presented as a benchmark to contr
fiber optic network
, and equal-capability leased al
ternatives from carriers.
3
4
5
6
7
8
$814,908
$1,093,080
$1,375,368
$1,662,372
$1,954,802
$2,253,492
Year
Cumulative Cost
- Current System
City of Ontario, California
Fiber Optic Master Plan
46 | P a g e
The costs represented above are for a level of service that would not likely serve the CITY’s
needs over the eight year span of this cost forecast. It is presented as a benchmark to contr
ast
ternatives from carriers.
Legacy
Telco
IP Internet
Drain

Figure 19 -
Eight Year Cumulative Cost Detail
Included within the chart / table in Figure
cost recovery
period applied to capitalize
months (7 years). Finally, in Year 7
electronics was included at an amount equal to the current network electronics.
$-
$1
$2
$3
$4
$5
$6
$7
1
2
3
Cumulative Cost - in Millions $
1
New Electronics
$
-
Maintenance
$29,399
Legacy Telco
$46,080
IP Internet Drain
$48,000
84 Mo. Cost Recovery
$971,353
Cumulative Cost
Phase 1 + 2 Construction Cost:
$ 6,799,471
Cost Recovery - 84 Months
City of Ontario, California
Fiber Optic Master Plan
Eight Year Cumulative Cost Detail
– CITY Fiber Optic Network
Included within the chart / table in Figure
19, there are a couple of
noteworthy
period applied to capitalize
the initial construction costs was established as 84
months (7 years). Finally, in Year 7
,
a cost allowance for replacement of the network
electronics was included at an amount equal to the current network electronics.
3
4
5
6
7
8
Year
2 3 4 5
6
$
-
$
-
$
-
$
-
$
$29,399
$58,799 $87,940 $117,080 $146,221
$175,362
$46,080
$92,160 $138,240 $184,320 $230,400
$276,480
$48,000
$103,200
$166,680
$239,688
$323,640
$420,180
$971,353
$1,942,70 $2,914,05 $3,885,41 $4,856,76
$5,828,11
Cumulative Cost
-
CITY Fiber Optic Network
City of Ontario, California
Fiber Optic Master Plan
47 | P a g e
noteworthy
items. First, the
the initial construction costs was established as 84
a cost allowance for replacement of the network
New Electronics
Maintenance
Legacy Telco
IP Internet Drain
84 Mo. Cost Recovery
6
7 8
$
-
$531,901
$
-
$175,362
$204,502 $233,902
$276,480
$322,560 $368,640
$420,180
$531,204
$658,884
$5,828,11
$6,799,47 $-
CITY Fiber Optic Network
New Electronics
Maintenance
Legacy Telco
IP Internet Drain
84 Mo. Cost
Recovery

Figure 20 -
Eight Year Cumulative Cost
Admittedly,
the large amount of data represented in Figures
Fiber Optic Network), and 20
(Leased Circuits) are difficult to compare as presented
display
ed with the individual cost
not shown. All summary cost
below.
$-
$1,000,000
$2,000,000
$3,000,000
$4,000,000
$5,000,000
$6,000,000
1
2
Cumulative Cost - in Million $
1
2
Legacy Telco
$46,080
$92,160
IP Internet Drain
$48,000
$103,200
Circuit Costs
$301,500
$603,000
Conn. Costs
$705,600
$1,411,200
Cumulative Cost
City of Ontario, California
Fiber Optic Master Plan
Eight Year Cumulative Cost
– Leased Circuits
the large amount of data represented in Figures
18
(Current System),
(Leased Circuits) are difficult to compare as presented
ed with the individual cost
components; total summary costs on a year-
by
summary cost
data from Figures 18, 19, and 20
are present
3
4
5
6
7
8
Year
3
4
5
6
$92,160
$138,240 $184,320 $230,400
$276,480
$103,200
$166,680 $239,688 $323,640
$420,180
$603,000
$904,500 $1,206,000 $1,507,500
$1,809,000
$1,411,200
$2,116,800
$2,822,400
$3,528,000
$4,233,600
Cumulative Cost
- Leased Circuits
City of Ontario, California
Fiber Optic Master Plan
48 | P a g e
(Current System),
19 (CITY
(Leased Circuits) are difficult to compare as presented
– when
by
-year basis are
are present
ed in Figure 21
Legacy Telco
IP Internet Drain
Circuit Costs
Conn. Costs
7
8
$276,480
$322,560 $368,640
$420,180
$531,204 $658,884
$1,809,000
$2,110,500 $2,412,000
$4,233,600
$4,939,200
$5,644,800
Legacy Telco
IP Internet Drain
Circuit Costs
Conn. Costs

Figure 21 –
Eight Year Cumulative Costs
Circuits
As might be expected, after the completion of the 84 month
the CITY Fiber Optic Network
drop below the costs for leased carrier circuits. Those savings
continue as time extends into the future, as demonstrated in Figure 2
1
2
3
Cumulative Costs - In Million $
Cumulative Costs
CITY Fiber Optic Network, & Leased Circuits
City of Ontario, California
Fiber Optic Master Plan
Eight Year Cumulative Costs
– Current, CITY Fiber Opt
ic Networks,
As might be expected, after the completion of the 84 month
cost recovery
period, the costs for
drop below the costs for leased carrier circuits. Those savings
continue as time extends into the future, as demonstrated in Figure 2
2 below.
4
5
6
7
8
$2,253,492
$8,601,418
$9,084,324
Year
Cumulative Costs
- Current Circuits,
CITY Fiber Optic Network, & Leased Circuits
City of Ontario, California
Fiber Optic Master Plan
49 | P a g e
ic Networks,
& Leased
period, the costs for
drop below the costs for leased carrier circuits. Those savings
$2,253,492
$8,601,418
$9,084,324
CITY Fiber Optic Network, & Leased Circuits
Current
Circuits
CITY Fiber
Optic
Network
Leased
Circuits

City of Ontario, California
Fiber Optic Master Plan
50 | P a g e
Figure 22 – Capital Cost Analysis
Figure 22 casts the construction costs over the 84 month cost recovery period as in prior
figures, but the CITY would not necessarily be bound by this approach to funding capital
construction projects. As one additional view of the costs to construct / operate the CITY Fiber
Optic Network, the following Figure 23 depicts the year-by-year cash costs, if the project was
fully funded at the start.
$-
$2,000,000
$4,000,000
$6,000,000
$8,000,000
$10,000,000
$12,000,000
$14,000,000
$16,000,000
$18,000,000
$20,000,000
Capital Cost Analysis
Construction Cost
Construction Plus
Maintenance
Costs
Construction,
Maintenance, &
New Electronics
Accumulated
Leased Costs

Figure 23 – Year-by-
Year Cash Costs
In consideration of the significant gains in capability
well se
rved by moving forward with deployment of these infrastructure resources.
1
2
3
4
Relative Costs (not to scale)
Year
1
2
Maintenance
$29,141 $29,400
Legacy Telco
$46,080 $46,080
IP Internet Drain
$48,000 $55,200
New Electronics
$
-
$
-
Construction Costs
$6,799,4
$
-
Year-
by
CITY Fiber Optic Network
$6,799,471
City of Ontario, California
Fiber Optic Master Plan
Year Cash Costs
– CITY Fiber Optic Network
In consideration of the significant gains in capability
and financial viability, the CITY would be
rved by moving forward with deployment of these infrastructure resources.
Maintenance
Legacy Telco
IP Internet Drain
New Electronics
Construction Costs
5
6
7
8
3
4
5
6
7
$29,399 $29,399 $29,399 $29,399
$29,399
$46,080 $46,080 $46,080 $46,080
$46,080
$63,480 $73,008 $83,952 $96,540
$111,024
$
-
$
-
$
-
$
-
$531,901
$
-
$
-
$
-
$
-
$
-
by-Year Cash Costs -
CITY Fiber Optic Network
Maintenance
Legacy Telco
IP Internet Drain
New Electronics
Construction Costs
City of Ontario, California
Fiber Optic Master Plan
51 | P a g e
and financial viability, the CITY would be
rved by moving forward with deployment of these infrastructure resources.
Maintenance
Legacy Telco
IP Internet Drain
New Electronics
Construction Costs
8
$29,399
$29,400
$46,080
$46,080
$111,024
$127,680
$531,901
$
-
$
-
Maintenance
Legacy Telco
IP Internet Drain
New Electronics
Construction Costs

City of Ontario, California
Fiber Optic Master Plan
52 | P a g e
APPENDIX A – SUPPORTING DOCUMENTS
Maintenance Requirements
Ongoing maintenance costs for an enterprise network are generally driven by one key element:
“What part of system maintenance can be performed with in-house resources?” In general
terms, the greater amount of support services that have to be provided by external resources,
the higher the ongoing cost to the CITY.
Other factors that impact on the maintenance costs include coverage days / hours, response
time, and onsite spares (self-insurance). For an organization like the CITY with an in-house IT
staff, it is reasonable to suggest that the appropriate amount of vendor services and ongoing
maintenance costs would likely fall toward the lower end of the range.
Among the available options from most vendors are combinations of technical support options,
replacement equipment options including advance replacement / next day / repair & return, and
the hours and days where vendor staff is available to provide onsite support. Following is a list
of examples that all drive / contribute to annual maintenance costs:
• Technical Support – Via Telephone Support
o Monday thru Friday – 8AM to 5PM
o 7 x 24 x 365
• Onsite Technical Support – Vendor Trained Technicians
o Monday thru Friday – 8AM to 5PM
o 7 x 24 x 365
• Equipment Replacement Options
o Same Day – 4 Hours or Less
o Next Business Day (overnight shipping)
o Repair & Return
o Onsite Spares – Critical Components Only
As might be expected, the specific costs are driven by a specific bill of materials, which currently
only exists at the conceptual level. Based upon the assumption that the majority of system
maintenance can be performed by the CITY IT department, and replacement equipment can be
vendor provided within a 4 hour response time, typical annual maintenance costs are
approximately 3% of initial installed costs, and can be reliably forecasted up to five years in
advance.
Given the conceptual designs for the network core devices, and edge devices for both indoor
and outdoor applications, here are the anticipated annual maintenance fees based upon the
level of service described above:
• Phase 1

City of Ontario, California
Fiber Optic Master Plan
53 | P a g e
o Projected Network Equipment Cost $ 703,129
o Estimated Annual Maintenance Fee $ 21,094
• Phase 2
o Projected Network Equipment Cost $ 103,872
o Estimated Annual Maintenance Fee $ 3,116
Fiber maintenance budgets are typically established to address a number of functions related to
the operation and management of a fiber optic network, including dispatch, fiber repairs, and
adds / moves / changes to the system. This allows the municipality to have reserve budget
capacity to accommodate future outages and changes to the system that may or may not
actually occur.
If warranted, the CITY would need to establish a relationship with a 3
rd
party contractor with the
task of receiving outage calls, dispatching repair crews, and restoring service to the affected
parties as quickly as possible. It would also be logical / cost effective for the CITY to maintain
inventories of a pre-established reserve of spare fiber and splice closures that can be provided
to the repair contractor as a part of any emergency restoration process. The CITY should have
the capability to find the right level of services for the repair contractor, and establish the level of
service / risk that matches their expected tolerance for outage. Specifically, it may be possible
to establish a year’s worth of cost for providing call center coverage, plus a per incident fee to
perform a truck roll to repair / splice fiber.
As a separate budgeting item, the CITY will need to also allocate costs for non-repair / changes
that will be required due to unknown but typical changes to a fiber optic infrastructure, such as
road realignments, locate services for work near the fiber network, and active network asset
changes. These events may or may not actually occur as an operating expense, but
allowances in the operating budgets must be considered to address these potential costs.
In general terms, an allowance can be derived from the overall fiber construction costs
(excluding active network electronics, engineering, and integration costs), and approximately
3% per year is generally accepted as a budgeted value to address both the emergency
restoration and operating changes. It is also worthwhile to mention that this 3% allowance
DOES NOT cover system changes that would otherwise be captured as capital expense costs,
such as a new CIP project or building a new lateral to an existing backbone.
Estimated Annual Fiber Restoration / Adds, Moves, & Changes Budget
• Phase 1 $ 99,500 (approximately)
• Phase 2 $ 42,500 (approximately)
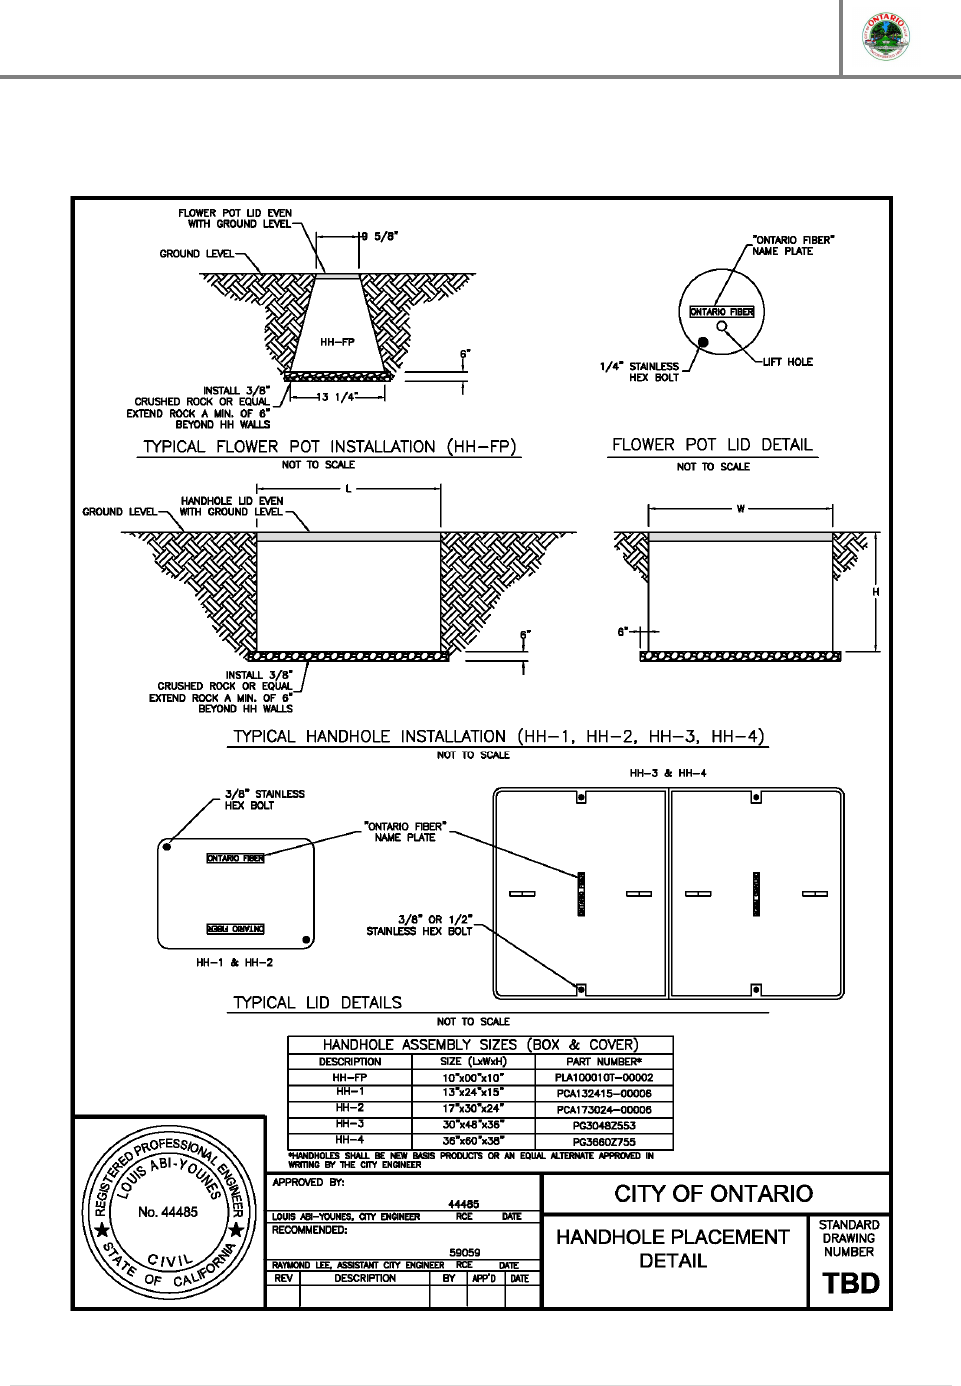
City of Ontario, California
Fiber Optic Master Plan
54 | P a g e
Updated Development Guidelines
Figure 24 – Recommended Standard Drawing

City of Ontario, California
Fiber Optic Master Plan
55 | P a g e
Through the course of developing the Fiber Optic Design Guidelines, the Figure 28 above is
recommended to be adopted as a Standard Drawing.
Design Guidelines
General Overview
Engineered drawings, otherwise known as plans, submitted by private design engineers (the
“Engineer”) to the CITY for plan check shall adhere to these Fiber Optic Design Guidelines,
whenever those plans involve the installation of new conduits in accordance with the CITY Fiber
Optic Master Plan, or along any local residential street, where fiber optic conduit is required to
connect to the homes.
The submitted plans will be checked by the CITY for conformance with the CITY’s standards
and policies, and for overall acceptability of the proposed design. The following guiding
documents are to be used by the Engineer in preparing the plans (in accordance with current
CITY requirements, including building codes, electrical codes, etc.). Other pertinent documents
may include Specific Plans, Master Plans, and the Conditions of Approval for the project.
Appendix A.5 of this document contains a “Fiber Optic Design Submittal Checklist” that must be
fully filled out by the Engineer and included with the submitted plans as part of the submittal
package. Other plans pertinent to the installation of Fiber Optic conduits (i.e. Public
Infrastructure Plans) shall also be provided with the plans submitted for review.
It is the responsibility of the Engineer to be knowledgeable in dry utility design, and to complete
a thorough quality assurance/quality control (QA/QC) review of the plans for errors BEFORE
submitting them to the CITY for plan check. Plans submitted with numerous designs and/or
drafting errors, drafted with poor quality workmanship, or missing significant information will be
rejected and returned.
Plans being re-submitted for a second or subsequent check shall include a new set of plans, the
previous set of plans containing the CITY’s red lines and comments, the design submittal
checklist and any other items that document any comments that have been exchanged between
the Engineer and the CITY.
Any and all submittals that do not contain all of the required components as identified in these
guidelines are subject to rejection, and may be returned for correction without being reviewed.
The Engineer should contact the CITY Engineering Department to determine whether there are
any special requirements for a project.

City of Ontario, California
Fiber Optic Master Plan
56 | P a g e
Drafting Standards
All plan sheets submitted shall be 24 inches by 36 inches with the standard CITY title block (in
accordance with CITY’s Standard Drawing No. 6004). Unless requested, title sheets are not
required. No sticky backs or paste-ons will be accepted. At the time of the final submittal,
copies of the drawings created shall be provided in CAD format (.dwg, .dxf) to the CITY on a
CD, DVD, or other acceptable digital media storage used at that time. All drawings submittal
shall utilize an “e-transmit” feature and include any reference drawings, plot files and text files
as necessary. Signatures must be “wet-originals” on the final submittal (Mylar).
Projects shall have a complete, master set of General Notes, Construction Notes, and/or
Legend of Special Symbols for the whole project on the first sheet of the set. Subsequent
project sheets shall require only those Construction Notes, and/or Legend of Special Symbols
applicable to that sheet. In no case should a Construction Note or Symbol be defined differently
on separate sheets of the same project. Undefined, nonstandard symbols shall not be used.
Reference to other drawings shall be made using the CITY assigned drawing number only. If a
drawing number has not yet been assigned, leave a blank space. Drawing numbers will not be
assigned until the CITY requests originals.
All surface features such as meter boxes, power poles, sidewalk, drive approaches, existing
signs, striping and markings, catch basins, gutters, signal equipment, street lights, existing
trees, etc., must be shown.
In those cases, where a project spans multiple jurisdictions, a signature block for each affected
agency shall be included on the title page and on each page where there is shared jurisdiction
on the project. All jurisdictional boundary lines must be shown on the plans.
All drawings are required to show a north arrow above the plan scale in the lower right hand
corner of the drawing, oriented toward either the top or the right side of the drawing. North
arrows shall be consistent with the type used as a CITY standard (in accordance with CITY
Standard Drawing No. 6003) at said time.
Short dashed lines are to be used when indicating existing equipment and improvements or are
planned to be installed by another plan sheet. Solid lines, even if drawn narrower, can be
erroneously construed as requiring installation of items that may currently exist.
All submitted plans shall be produced by ink-plotting, or by other permanent print methods.
Sepia Mylar prints will not be accepted.

City of Ontario, California
Fiber Optic Master Plan
57 | P a g e
Fiber Optic Plan Standards
The following standards shall be applied to all Fiber Optic Plans:
• The scale of the plans shall be 1”=40’ or 1”=20’ depending on the complexity of the plan
and clarity.
• The drawing title shall list the name of the street upon which the lights are located on
and a corresponding cross street name.
• Fiber Optic plans are identified by “O-…” drawing numbers.
• All utilities must be shown.
o If applicable, indicate possible conflicts with irrigation systems, street light
systems, and/or other utilities. Identify corrective action to be taken by
Contractor should damage occur.
• Where Fiber Optic improvements exist, or are proposed on private property (behind
ROW line) indicate existence of, or need for, encroachment and maintenance
easements. Appropriate easements must be provided prior to approval of plans for
private developments. Pertaining to CITY projects, acquisition will be coordinate with
CITY personnel.
• All dimensions for street(s), lane width(s), and utility location(s) are to be provided
between centerline and curb.
• It is the design engineer’s responsibility to ascertain and provide for minimum clearance
requirements between the fiber optic conduit and all other utilities, railroads, easements,
etc. All clearances shall be in accordance with CAL/OSHA, PUC and other jurisdictional
agencies that are involved.
Fiber Optic Design – Old Model Colony
It is understood that in the Old Model Colony, very little, if any of the fiber optic conduit
construction will be in undeveloped area(s), which is known as “greenfield” development. For
this reason, it is proposed that most fiber optic conduit construction will be infill and will attempt
to “piggy back” on other CITY Improvement Projects. Placement of fiber optic conduits will be
more complicated in OMC than in the New Model Colony (NMC), as NMC is unimproved (or
greenfield). It is preferred that all Fiber Optic Conduits be placed underneath the sidewalk when
applicable; however, it is understood construction may require trenching in the existing street(s).
These situations will be reviewed and approved on a case-by-case situation.
Cross sections for trenching the different levels of network hierarchy are provided in Design
Guideline Figures 1 thru 4, which not only include individual trenching details but also include
joint trenching details. Where it is preferred or required to directional bore the conduits, Design
Guideline Figure 5 provides Directional Boring details. Submitted plans will be required to show
the appropriate boring pit locations, and identify all utilities. Prior to boring (and during as
necessary) potholing the utilities will be required.

City of Ontario, California
Fiber Optic Master Plan
58 | P a g e
Fiber Optic Design – New Model Colony
NMC provides a unique fiber optic conduit construction opportunity as most Major, Residential
and Collector streets have yet to be constructed. Within NMC, similar to the Old Model Colony,
where applicable, trenching, joint trenching, and boring shall be used to install the Fiber
Conduits and the previous reference Figures to be utilized. Fiber Optic conduit placement will
generally be in a joint trench with Street Light conduits, placed behind the curb and under the
sidewalk resulting conduit placement will be on the north side of street and the east side of
street. It is acknowledged that upon full build out of NMC, conduit will be installed on both sides
of the streets; however, for new street improvements, fiber optic conduits shall be placed as
recommended above.
Fiber Optic Standards
All Fiber Optic Cable recommended within the Master Plan will be approved by the Engineering
Department. The following are the general requirements and description and must be
equivalent to the Fiber Optic Characteristics detailed listed in the Fiber Optic Master Plan
supporting memorandum, Conceptual Layout of Needed Infrastructure Memorandum.
Singlemode Loose Tube Non-Armored
• Gel-Free/ Dry High Density Buffer Tubes
• Twelve (12) Fibers Per Each Buffer Tube
• Color Coded Buffer Tubes
• Jacketed Central Member
• Dielectric Strength Elements
• Outer Polyethylene (PE) Jacket
• Sequential Markings (Meters)
• Ripcord
• Meets ITU-T G.655 (2009)
• Follows ANSI/TIA/EIA

City of Ontario, California
Fiber Optic Master Plan
59 | P a g e
Conduit Standards
All Conduit recommended within the Master Plan will be approved by the Engineering
Department. The minimum acceptable depth for fiber optic cabling / fiber optic conduits shall be
36”. The following are the general design standards to comply with:
Primary Ring (PR)
One (1) - 2” HDPE SDR-11 (Smoothwall) roll pipe (Orange) or equivalent
Two (2) - 7 Way MicroDuct (Duraline) – 16mm Tubes or equivalent
Secondary Ring (SR)
One (1) - 2” HDPE SDR-11 (Smoothwall) roll pipe (Orange) or equivalent
One (1) - 7 Way MicroDuct (Duraline) – 16mm Tubes or equivalent
Laterals
One (1) - 2” HDPE SDR-11(Smoothwall) roll pipe (Orange) or equivalent
One (1) - 7 Way MicroDuct (Duraline) – 16mm Tubes or equivalent
Handhole Placement
The fiber optic conduit infrastructure design will place and utilize five (5) different sized
Handholes within the communication infrastructure and Handhole details can be found in CITY
Standard Drawing No. TBD. Each Handhole has a unique use and placement, and the table
below illustrates, based on fiber strand count, when each will be used:
Handhole Utilization - Fiber Strand Count
Table 7 – Handhole Utilization – Fiber Strand Count
Description Fiber Strand Count
HH-FP Less than or equal to 6 strands
HH-1 Less than or equal to 144 strands
HH-2 Less than or equal to 288 strands
HH-3 Less than or equal to 432 strands
HH-4 Greater than 432 strands

City of Ontario, California
Fiber Optic Master Plan
60 | P a g e
General Handhole Spacing Requirements
It is understood that as each project (Backbone / Lateral / Residential / In-tract) will require a
unique design, so an exact standard will not fit the bill. Boxes along the backbone are generally
placed every 500’ to allow for pulling in the fiber and splicing to adjacent buildings and
infrastructure.
Conduits sweeping into the Handholes shall enter in flush with the cut out mouse holes aligned
parallel to the bottom of the box and come in perpendicular to the wall of the box. See Design
Guideline Figure 6 for Handhole Conduit Entry. Conduits shall not enter at any angle other than
near parallel. Sweeps from the mainline to the conduit shall be accomplished using radii
recommended by the manufacturer -- see Design Guideline Figure 7 for details.
Bid Quality Standard Drawings & Specifications
The Fiber Optic Design Guidelines reference the following cross-sections drawings that are to
be used in developing any Fiber Optic Construction Drawings.

Primary Ring (PR)
Install one (1) 2” HDPE and two (2) 7
Optic Design Guidelines. Trenching shall be per
Design Guideline Figure 1 –
Primary
City of Ontario, California
Fiber Optic Master Plan
Install one (1) 2” HDPE and two (2) 7
-way (16mm) MicroD
uct in accordance with
Optic Design Guidelines. Trenching shall be per
CITY Std. 1306.
Primary
Ring (PR)
City of Ontario, California
Fiber Optic Master Plan
61 | P a g e
uct in accordance with
CITY Fiber

Primary Ring
Plus (+) 2” Duct (P
Install two (2) 2” HDPE and two (2) 7
Optic Design Guidelines. Trenching shall be per
Design Guideline Figure 2 –
Primary
City of Ontario, California
Fiber Optic Master Plan
Plus (+) 2” Duct (P
R+2”)
Install two (2) 2” HDPE and two (2) 7
-way (16mm) MicroD
uct in accordance with
Optic Design Guidelines. Trenching shall be per
CITY Std. 1306.
Primary
Ring Plus (+) 2” Duct (PR+2”)
City of Ontario, California
Fiber Optic Master Plan
62 | P a g e
uct in accordance with
CITY Fiber

Secondary Ring (SR)
Install one (1) 2” HDPE and one (1) 7
Optic Design Guidelines. Trenching shall be per
Design Guideline Figure 3 –
Secondary
City of Ontario, California
Fiber Optic Master Plan
Install one (1) 2” HDPE and one (1) 7
-way (16mm) MicroD
uct in accordance with
Optic Design Guidelines. Trenching shall be per
CITY Std. 1306.
Secondary
Ring (SR)
City of Ontario, California
Fiber Optic Master Plan
63 | P a g e
uct in accordance with
CITY Fiber

CIP Joint Build (Stepped Trench Detail)
Install one (1) 2” HDPE and one (1) 7
Optic Design Guidelines. This design guideline will be used in “in
joint trench CIP projects can utilized.
Design Guideline Figure 4 –
CIP Joint Build (Stepped Trench Detail)
City of Ontario, California
Fiber Optic Master Plan
CIP Joint Build (Stepped Trench Detail)
Install one (1) 2” HDPE and one (1) 7
-way (16mm) MicroD
uct in accordance with
Optic Design Guidelines. This design guideline will be used in “in
-
fill” situations (OMC) where
joint trench CIP projects can utilized.
CIP Joint Build (Stepped Trench Detail)
City of Ontario, California
Fiber Optic Master Plan
64 | P a g e
uct in accordance with
CITY Fiber
fill” situations (OMC) where

Trench Detail Notes
Note:
The above Trench Detail Notes are the
Drawing 1306
City of Ontario, California
Fiber Optic Master Plan
The above Trench Detail Notes are the
CITY’s
standard and can be found on Standard
City of Ontario, California
Fiber Optic Master Plan
65 | P a g e
standard and can be found on Standard

Directional Bore Detail
Design Guideline Figure 5 -
Directional Bore Detail
City of Ontario, California
Fiber Optic Master Plan
Directional Bore Detail
City of Ontario, California
Fiber Optic Master Plan
66 | P a g e

City of Ontario, California
Fiber Optic Master Plan
67 | P a g e
Handhole Conduit Entry Detail
Design Guideline Figure 3 - Handhole Conduit Entry Detail
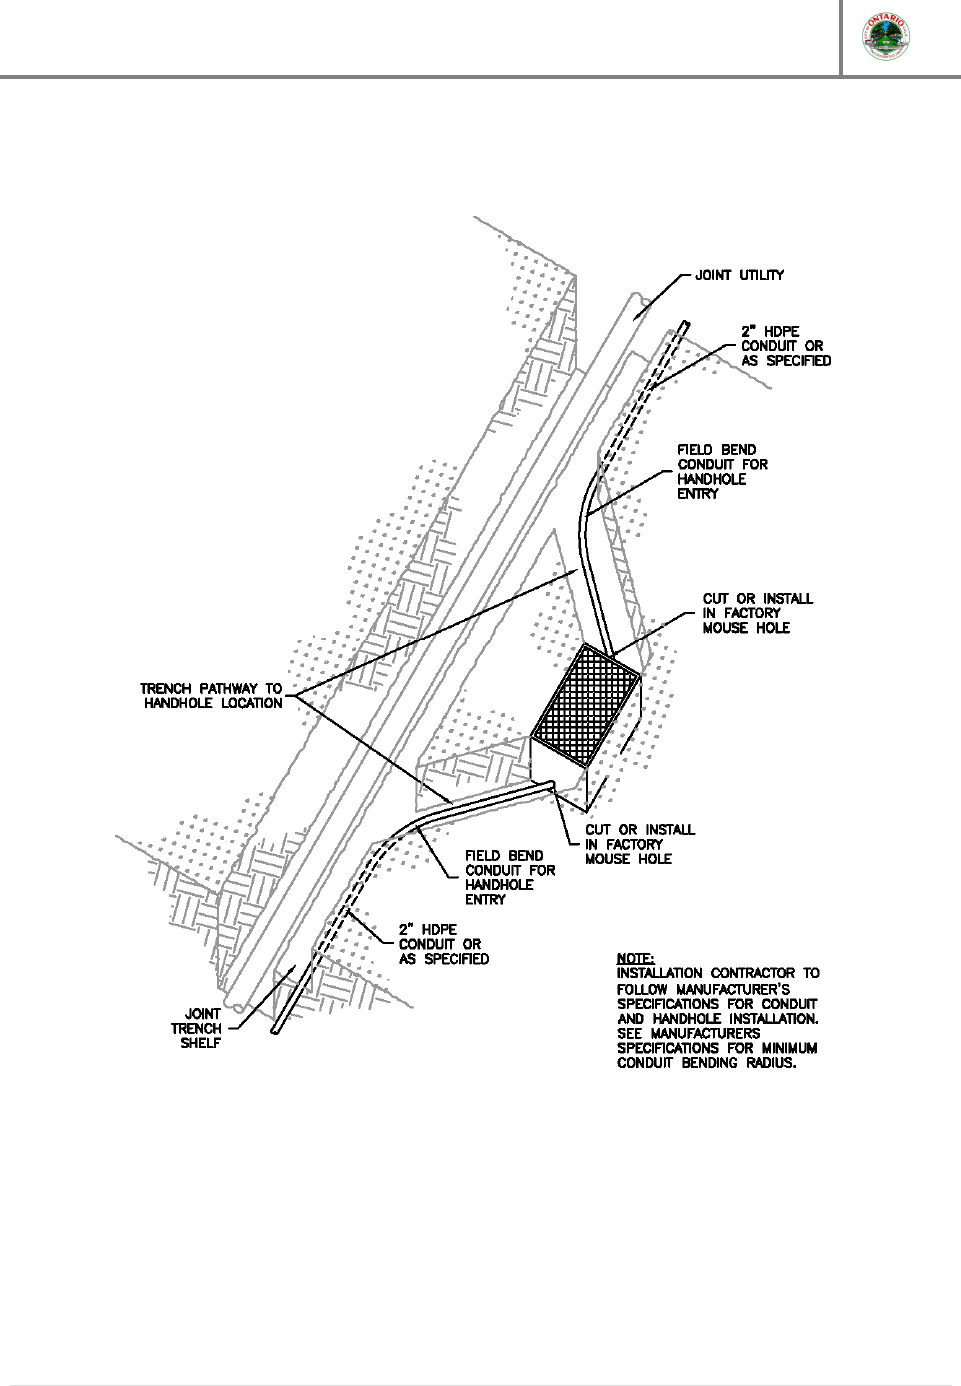
Conduit Sweep Details
(Joint Trench Installation)
Design Guideline Figure 7 -
Conduit Sweep Details (Joint Trench Installation
City of Ontario, California
Fiber Optic Master Plan
(Joint Trench Installation)
Conduit Sweep Details (Joint Trench Installation
City of Ontario, California
Fiber Optic Master Plan
68 | P a g e
Conduit Sweep Details (Joint Trench Installation
)

City of Ontario, California
Fiber Optic Master Plan
69 | P a g e
Glossary
TERM
DEFINITION
10 Gigabit Ethernet
Defined by the IEEE 802.3ae-2002 standard for transmitting Ethernet frames
at the rate of 10 gigabits per second, approximately 10 billion bits per
second.
100 Gigabit Ethernet
Defined by the IEEE 802.3ba-2010 standard for transmitting Ethernet frames
at the rate of 100 gigabits per second.
40 Gigabit Ethernet
Defined by the IEEE 802.3ba-2010 standard for transmitting Ethernet frames
at the rate of 40 gigabits per second.
7-Way Microduct
A 2” outside diameter polyethylene conduit that contains 7 smaller
microducts, each usually 16mm outside diameter. Allows access for future
cable installation in an underground raceway already in place.
Access Layer
Layer 2 and 3 functionality in the OSI (Open System Interconnection) model,
where initial network users are transported to the nearest POP and
interconnected with the Transport Layer. CITY Access Layer data rate is 1
Gbps.
Bandwidth
The information carrying capability of any transmission media, including fiber
optic and copper cabling, as well as wireless communications.
Bit
The smallest unit of data, a binary 1 or 0. Commonly expressed as a lower-
case “b” in discussion of a data transfer rate, like Kilobits per second (Kbps)
or Megabits per second (Mbps).
Byte
A byte consists of 8 bits of data, originally used to encode a single character,
and is commonly expressed as an upper-case “B” in reference to data file
storage sizes, like Megabytes (MB) or Gigabytes (GB).
Carrier
A common term applied in telecommunications to describe a services
vendor, including regulated or unregulated telephone companies.
Circuit Costs
An ongoing monthly expense that is directly related to provisioning on that
circuit that establishes the maximum data rate (bandwidth) of the circuit.
Imagine this as the “water” inside the garden hose part of the information
transport system.
Co-Location
A technology term that describes sharing of space within a common
technology infrastructure, such as an equipment room or cabinet.
Connection Costs
One-time charges to install wiring & equipment, plus ongoing monthly
expense to maintain the connection, equipment, and system records.
Imagine this as the “garden hose” part of the information transport system.
Core Rings
Also referred to as Primary Backbones. Within the CITY fiber infrastructure,
Core Rings are fiber routes that include either one or two 432-strand fiber
optic cables.
Ethernet
Ratified by the IEEE 802.3 standard in 1985 and originally established with a
data rate of 10 Mbps, it has emerged as the base networking protocol upon
which most of the current network principles are derived.
Fast Ethernet
An extension of the IEEE 802.3u Ethernet standard (1995) developed to
support a data rate of 100Mbps.
Frame Relay
An early analog technology developed to support demand for higher-speed
data circuits, typically a shared resource pool across multiple customers.
Considered a mid-range service between subrate T-1s and ISDN.
Gigabit Ethernet
Formally adopted by IEEE 802.3-2008, at a data rate of 1 Gbps, or roughly
one billion bits per second. The CITY infrastructure will use 1 Gbps
connectivity on the Access Layer.
Gigabyte (GB)
Units of measure to describe file sizes, consisting of 1,024 megabytes, or
roughly 1 billion bytes of data.

City of Ontario, California
Fiber Optic Master Plan
70 | P a g e
TERM
DEFINITION
Handhole
An underground enclosure for installing, splicing, and testing of both fiber
optic and copper cabling. Usually sized in accordance with conduit and
cable entrances, but not large enough for a person to enter.
IP Internet Drain
The circuit / interconnection from the private CITY Fiber Optic Network to the
public carrier network. The ongoing monthly expense for this interconnection
is driven by the maximum data rate (bandwidth) of the circuit. This is where
traffic will leave the CITY network and interconnect with the Internet / users
not on the CITY Fiber Optic Network.
Kilobyte (KB) Units of measure to describe file sizes, consisting of 1,024 bytes.
Local Area Network (LAN)
Sometimes referred to as LAN, describes a computer network that is
generally within a single building, or a campus of buildings sharing a single
physical property.
Lateral
Fiber optic cables ranging from 12 to 144 strands that branch off the Primary
Backbones or Secondary Backbones to interconnection points.
Metropolitan Area Network
(MAN)
Describes a network that is generally larger than a Local Area Network
(LAN), but not as large as a Wide Area Network (WAN). The CITY network
would be a good example of a Metropolitan Area Network (MAN), as it is
largely confined to the areas of OMC and NMC.
Megabyte
Units of measure to describe file sizes, consisting of 1,024 kilobytes, or
roughly 1 million bytes of data.
Passive Optical Network
(PON)
A point-to-multipoint, fiber to the premises network architecture in which
unpowered optical splitters are used to engage a single singlemode optical
fiber that serves multiple premises, and is a form or a fiber-optic access
network.
Point Of Presence (POP)
POPs usually describe the point where different networks meet, derived from
the Bell Telephone System terminology to define the point of delivery for a
particular voice or data service.
Secondary Rings
Also referred to as Secondary Backbones. Within the CITY fiber
infrastructure, Secondary Rings are fiber routes that include either one or
two 432- or 288-strand fiber optic cables.
Transport Layer
Layer 4 in the OSI (Open System Interconnection) model, where powerful,
high speed data forwarding decisions can be made with consideration of the
data payload type. CITY Transport Layer data rate is 10 Gbps.
Wide Area Network (WAN)
Describes a network that covers a broad geographic area, and usually
consists of a combination of private and public network resources. With the
emergence of Cloud-based technologies, even the Internet could be
considered as a Wide Area Network (WAN).

City of Ontario, California
Fiber Optic Master Plan
71 | P a g e
Acronyms
ANSI American National Standards Institute
CIP Capital Improvement Program
bps bits per second
Gbps Gigabits per second (roughly equal to 1 billion bits per second)
HDPE High-Density Polyethylene
ISDN Integrated Services Digital Network
ITU-T International Telecommunications Union - Telecom
Kbps Kilobits per second (roughly equal to 1 thousand bits per second)
LAN Local Area Network
MAN Metropolitan Area Network
Mbps Megabits per second (roughly equal to 1 million bits per second)
PON Passive Optical Network
POP Point of Presence
SDR-11 Standard Dimension Ratio, pipe diameter is 11x pipe wall thickness
T-1 Digital carrier circuit with a data rate of 1.544 Mbps
TIA Telecommunications Industry Alliance
WAN Wide Area Network

City of Ontario, California
Fiber Optic Master Plan
72 | P a g e
Reference Documents
Technical Memorandum – System Inventory Memorandum
Conceptual Layout & Needs Assessment Memorandum
Concept of Operations
Fiber Optic Conduit Design Guidelines
Fiber Optic Design Submittal Checklist

City of Ontario, California
Fiber Optic Master Plan
73 | P a g e
1. Map Table Index
N
UMBER
M
APS
D
ESCRIPTIONS
101 NMC Facility Map 050813
Illustrates the future facilities currently identified in
NMC
102 NMC Fiber Size Map 050813
Illustration of the proposed fiber location and the
fiber count with a complete build-out
103 NMC Infrastructure Map 050813
Illustration of the number of conduits and conduit
sizes upon complete build-out
104 NMC Metro Ring Map 050813
Illustration of the fiber ring topology upon complete
build-out
105 OMC Facility Map 050813
Illustration of all facilities identified in the process
including the Centennial Park POP location
106 OMC Fiber Size Map 050813
Illustration of the fiber count of the network and the
locations of the facilities that will be touched
107 OMC Infrastructure Map 050813
Illustration of the conduit size in the network along
with the CIP’s that would be utilized
108 OMC Metro Ring Map 050813
Illustration of the fiber ring topology upon complete
build-out
109 OMC-NMC Facility Map 050813
Illustration of the ring topology covering both OMC
and NMC and the location of the identified facilities
off the rings
110 OMC-NMC Interconnect 050813 Illustration of the interconnection of OMC and NMC
111 OMC Phase Key Target Map 050813
In the Phased approach, an illustration of all the
identified key targets that the network would
provide
112 OMC Phase Traffic Map 050813
Illustration of all the types of traffic signals the OMC
network will touch in the Phased approach
113 OMC Metro Ring Phase 1 Map 050813 Illustration of Phase 1 construction
114 OMC Metro Ring Phase 2 Map 050813 Illustration of Phase 2 construction
2. Phase 1 Construction
2.1. Building Interconnections
NAME ADDRESS LABEL
PHASE
Bon View Community
Center
1010 S Bon View Avenue 3 1
Ontario City Hall 303 E B Street 4 1
Senior Center 225 E B Street 5 1
City Hall East (Annex) 200 N Cherry Avenue 6 1
Fire Station #1/Fire Admin 425 E B Street 7 1
Main Library 215 E C Street 8 1
Museum of History and Art 225 S Euclid Avenue 9 1
South Library 3850 Riverside Drive 10 1
Citizens Business Bank
Area
4000 E Ontario Center
Pkwy
11 1

City of Ontario, California
Fiber Optic Master Plan
74 | P a g e
NAME ADDRESS LABEL
PHASE
Fire Station #3 1408 E Francis Street 16 1
Fire Station #5 1530 E Forth Street 18 1
Fire Station #6
2931 E Philadelphia
Street
19 1
Fire Station #7 4901 E Vanderbilt Street 20 1
Fire Station #8 3429 E Shelby Street 21 1
Ontario Municipal Utilities
Agency
1425 S Bon View Avenue 22 1
Police Department Mills
Substation
1 E Mills Circle 23 1
Police Headquarters 2500 S Archibald Avenue 24 1
Westwind Community
Center
2425 E Riverside Drive 26 1
Revenue (next to OMUC) 1333 S Bon View Avenue 28 1
Housing / Code
Enforcement
208 W Emporia Street 29 1
Ontario Convention Center
2000 E Convention
Center Way
30 1
Ontario Town Center Plaza
(Downtown Park)
Between B and C Street
on Euclid
34 1
NMC West POP Centennial Park
Future
NMC East POP-Collocation
Facility
3151 E Riverside Drive
1
OMC East POP City Arena
1
OMC West POP City Hall
1
Ontario Soccer Complex 2200 E Philadelphia St 47 1
2.2. Traffic Signals
NAME LOCATION (N/S Street / E/W Street) LABEL
PHASE
Traffic Signal - 001 Sultana Ave @ Mission Blvd TS001 1
Traffic Signal - 002 Campus Ave @ Mission Blvd TS002 1
Traffic Signal - 003 Grove Ave @ Francis St TS003 1
Traffic Signal - 004 Baker Ave @ Francis St TS004 1
Traffic Signal - 005 Vineyard Ave @ Francis St TS005 1
Traffic Signal - 006 Archibald Ave @ Francis St TS006 1
Traffic Signal - 007 Archibald Ave @ Cedar St TS007 1
Traffic Signal - 008 Archibald Ave @ Philadelphia St TS008 1
Traffic Signal - 009 Archibald Ave @ Oak Hill Dr TS009 1
Traffic Signal - 010 Archibald Ave @ Walnut St TS010 1
Traffic Signal - 011 Archibald Ave @ Riverside Dr TS011 1
Traffic Signal - 012 Turner Ave @ Riverside Dr TS012 1
Traffic Signal - 013 Haven Ave @ Riverside Dr TS013 1

City of Ontario, California
Fiber Optic Master Plan
75 | P a g e
NAME LOCATION (N/S Street / E/W Street) LABEL
PHASE
Traffic Signal - 014 Mill Creek Rd@ Riverside Dr TS014 1
Traffic Signal - 015 Edenglen Ave @ Riverside Dr TS015 1
Traffic Signal - 016 Milliken Ave @ Riverside Dr TS016 1
Traffic Signal - 017 Milliken Ave @ Greystone Dr TS017 1
Traffic Signal - 018 Milliken Ave @ Mission Blvd TS018 1
Traffic Signal - 019 Milliken Ave @ Philadelphia St TS019 1
Traffic Signal - 020 Milliken Ave @ Francis St TS020 1
Traffic Signal - 021 Milliken Ave @ Toyota Way TS021 1
Traffic Signal - 022 Milliken Ave @ Jurupa St TS022 1
Traffic Signal - 023 Milliken Ave @ Santa Ana St TS023 1
Traffic Signal - 024 Milliken Ave @ Brickell St TS024 1
Traffic Signal - 025 Milliken Ave @ Airport Dr TS025 1
Traffic Signal - 026 Milliken Ave @ Guasti Rd TS026 1
Traffic Signal - 027 Milliken Ave @ Ontario Mills Pkwy TS027 1
Traffic Signal - 204
Milliken Ave @ Inland Empire Blvd / Mall
Dr
TS204 1
Traffic Signal - 028 Milliken Ave @ Concours St TS028 1
Traffic Signal - 029 Milliken Ave @ Fourth St TS029 1
Traffic Signal - 030 Via Turin @ Fourth St TS030 1
Traffic Signal - 031 Via Asti @ Fourth St TS031 1
Traffic Signal - 032 Duesenberg Dr @ Fourth St TS032 1
Traffic Signal - 033 Haven Ave @ Fourth St TS033 1
Traffic Signal - 034 Center Ave @ Fourth St TS034 1
Traffic Signal - 035 Turner Ave @ Fourth St TS035 1
Traffic Signal - 036 Archibald Ave @ Fourth St TS036 1
Traffic Signal - 037 Smiderle Loop @ Fourth St TS037 1
Traffic Signal - 038 Vineyard Ave @ Fourth St TS038 1
Traffic Signal - 039 Vineyard Ave @ Inland Empire Blvd TS039 1
Traffic Signal - 040 Vineyard Ave @ G St TS040 1
Traffic Signal - 041 Vineyard Ave @ D St TS041 1
2.3. Well Aggregation Sites
PHASE WELL #
1 WELL # 34
1 WELL # 37
1 WELL # 50

City of Ontario, California
Fiber Optic Master Plan
76 | P a g e
2.4. CIP Projects
ROUTE
DESCRIPTION
CIP
DESCRIPTION
CIP NUMBER
LOCATION PHASE
Primary
Backbone
City Water MOID P24031 Bon View Ave south of Belmont St. 1
Primary
Backbone
City Water MOID P24039 Bon View Ave south of Woodlawn St. 1
Primary
Backbone
City Water MOID P23420
Maitland St between Caldwell Ave and
Taylor Ave
1
Primary
Backbone
City Water MOID P23429
Maitland St between Campus Ave and
Caldwell Ave
1
Primary
Backbone
City Water MOID P23430 Campus Ave North of Maitland St 1
Primary
Backbone
City Water MOID P20951 Mission Blvd West of Campus Ave 1
Primary
Backbone
City Water MOID P23395 Mission Blvd West of Campus Ave 1
Primary
Backbone
City Water MOID P25820 Lemon Ave south of Transit St 1
Primary
Backbone
City Water MOID P25816 Transit St East of Euclid Ave 1
Primary
Backbone
City Water MOID P15955 Emporia St West of Plum Ave 1
Primary
Backbone
City Water MOID P21081 Nocta St and Allyn Ave 1
Primary
Backbone
City Water MOID P18203 Nocta St and Allyn Ave 1
3. Phase 2 Construction
3.1. Building Interconnections
NAME ADDRESS PHASE
Anthony Munoz Community
Center
2140 W Fourth 2
Armstrong Community Center 1265 S Palmetto Avenue 2
De Anza Teen and Community
Center
1405 S Fern Avenue 2
Fire Station #2 544 W Francis Street 2
Fire Station #4 1005 N Mountain Avenue 2
Police Department North
Substation
Sixth Street and Mountain
Avenue
2
3.2. Traffic Signals
NAME LOCATION
(N/S STREET / E/W STREET)
LABEL PHASE

City of Ontario, California
Fiber Optic Master Plan
77 | P a g e
NAME LOCATION
(N/S STREET / E/W STREET)
LABEL PHASE
Traffic Signal - 042 Mountain Ave @ Fifth St TS042 2
Traffic Signal - 043 Mountain Ave @ Fourth St TS043 2
Traffic Signal - 044 Mountain Ave @ J St TS044 2
Traffic Signal - 045 Mountain Ave @ I St TS045 2
Traffic Signal - 046 Mountain Ave @ G St TS046 2
Traffic Signal - 047 Mountain Ave @ D St TS047 2
Traffic Signal - 048 Mountain Ave @ Holt Blvd TS048 2
Traffic Signal - 049 Mountain Ave @ Mission Blvd TS049 2
Traffic Signal - 050 Mountain Ave @ Phillips St TS050 2
Traffic Signal - 051 Mountain Ave @ Francis St TS051 2
3.3. Well Aggregation Site
WELL NO. PHASE
WELL # 45 2
3.4. CIP Projects
ROUTE
DESCRIPTION
CIP
DESCRIPTION
CIP
NUMBER
LOCATION PHASE
Secondary Ring City Water
MOID
P29045
Francis St East of San Antonio Ave. 2
Secondary Ring City Water MOID P-1713 Francis St West of Euclid Ave 2
Secondary Ring City Water
MOID
P24422
Francis St East of Fern Ave 2
Secondary Ring City Water MOID P-1712 Francis St West of Euclid Ave 2
Secondary Ring City Water
MOID
P15143
Lynn Haven St East of Sultana Ave 2
Secondary Ring City Water
MOID
P14369
Lynn Haven St between Sultana Ave and
Monterey Ave
2
Secondary Ring City Water
MOID
P13487
Fifth St West of College Ave 2
Secondary Ring City Water
MOID
P13485
Fifth St West of College Way. 2
Secondary Ring City Water
MOID
P13169
Fifth St East of Mountain Ave and West
of Boulder Ave
2
Secondary Ring City Water
MOID
P13431
Fifth St between Euclid Ave and College 2
Secondary Ring City Water
MOID
P13427
Fifth St East of Euclid Ave 2
Secondary Ring City Water
MOID
P12635
Fifth St West of Euclid Ave 2
Secondary Ring City Water
MOID
P13368
Fifth St between Palm Ave and Euclid
Ave
2

City of Ontario, California
Fiber Optic Master Plan
78 | P a g e
ROUTE
DESCRIPTION
CIP
DESCRIPTION
CIP
NUMBER
LOCATION PHASE
Secondary Ring City Water
MOID
P10680
Fifth St West of Palm Ave 2
Secondary Ring City Water
MOID
P13246
Fifth St between Vine Ave and Bonnie
Brae Ct
2
Secondary Ring City Water
MOID
P13212
Fifth St East of Chaffey Ct and West of
Vine
2
Secondary Ring City Water
MOID
P13220
Fifth St West Chaffey Ct 2
Secondary Ring City Water
MOID
P13221
Fifth St West Chaffey Ct 2
Secondary Ring City Water
MOID
P13223
Fifth St between San Antonio Ave and
Alley
2
Secondary Ring City Water
MOID
P10062
Fifth St between San Antonio Ave and
Alley
2
Secondary Ring City Water
MOID
P10072
Fifth St East of San Antonio Ave 2
Secondary Ring City Water
MOID
P12916
Fifth St West of San Antonio Ave 2
Secondary Ring City Water
MOID
P10073
Fifth St West of San Antonio Ave 2
Secondary Ring City Water
MOID
P13076
Fifth St East of Granite Ave West of San
Antonio Ave
2
Secondary Ring City Water
MOID
P13241
Fifth St East of Boulder Ave and West of
Granite Ave
2
4. Phase - Future Construction
4.1. Building Interconnections
NAME ADDRESS LABEL
PHASE
Cucamonga Storage
Building
1440 S Cucamonga Avenue 13 Future
Homer Biggs Park 2051 S Oaks Avenue 27 Future
Ontario Police Air Support
2009 Porterfield Way,
Upland, CA
46 Future
Whispering Lakes Golf
Course
2525 E Riverside Drive 32 Future / NMC
Ontario Soccer Complex 2200 E Philadelphia 47 Future
4.2. Traffic Signals – OMC
NAME LOCATION
(N/S STREET / E/W STREET)
LABEL PHASE

City of Ontario, California
Fiber Optic Master Plan
79 | P a g e
NAME LOCATION
(N/S STREET / E/W STREET)
LABEL PHASE
Traffic Signal - 052 Bon View Ave @ Mission Blvd TS052 FUTURE
Traffic Signal - 053 Cucamonga Ave @ Mission Blvd TS053 FUTURE
Traffic Signal - 054 Grove Ave @ Mission Blvd TS054 FUTURE
Traffic Signal - 055 South of Airport Dr @ Grove Ave TS055 FUTURE
Traffic Signal - 056 Grove Ave @ Airport Dr TS056 FUTURE
Traffic Signal - 057 Grove Ave @ Holt Blvd TS057 FUTURE
Traffic Signal - 058
West of Cucamonga Channel Wash @ Airport Dr
TS058 FUTURE
Traffic Signal - 059 Vineyard Ave @ Airport Dr TS059 FUTURE
Traffic Signal - 060 Moore Way @ Airport Dr TS060 FUTURE
Traffic Signal - 061 Terminal Way @ Airport Dr TS061 FUTURE
Traffic Signal - 062 Archibald Ave @ Airport Dr TS062 FUTURE
Traffic Signal - 063 Terminal Way @ Airport Dr TS063 FUTURE
Traffic Signal - 064 Rental Car Rd @ Airport Dr TS064 FUTURE
Traffic Signal - 065 Haven Ave @ Airport Dr TS065 FUTURE
Traffic Signal - 066 Carnegie Ave /Commerce Way @ Airport Dr TS066 FUTURE
Traffic Signal - 067 Doubleday Ave @ Airport Dr TS067 FUTURE
Traffic Signal - 068 Wineville Ave @ Airport Dr TS068 FUTURE
Traffic Signal - 069 Etiwanda Ave @ Airport Dr TS069 FUTURE
Traffic Signal - 070 Ontario Mills Pkwy @ Etiwanda Ave TS070 FUTURE
Traffic Signal - 071 Distribution Way @ Etiwanda Ave TS071 FUTURE
Traffic Signal - 072 Etiwanda Ave @ Fourth St TS072 FUTURE
Traffic Signal - 073 Barrington Ave @ Fourth St TS073 FUTURE
Traffic Signal - 074 Wineville Ave @ Fourth St TS074 FUTURE
Traffic Signal - 075 Franklin Ave @ Fourth St TS075 FUTURE
Traffic Signal - 076 Richmond Place @ Fourth St TS076 FUTURE
Traffic Signal - 077 Gurnee Ave @ Fourth St TS077 FUTURE
Traffic Signal - 078 Rochester Ave @ Ontario Mills Dr TS078 FUTURE
Traffic Signal - 079 Rochester Ave @ Ontario Mills Pkwy TS079 FUTURE
Traffic Signal - 080 Ontario Mills Dr @ Ontario Mills Pkwy TS080 FUTURE
Traffic Signal - 081 Franklin Ave @ Ontario Mills Pkwy TS081 FUTURE
Traffic Signal - 082 West of Franklin Ave @ Ontario Mills Pkwy TS082 FUTURE
Traffic Signal - 083 West of Milliken @ Concours St TS083 FUTURE
Traffic Signal - 084 Ontario Ctr Pkwy @ Concours St TS084 FUTURE
Traffic Signal - 085 Ferrari Ln @ Concours St TS085 FUTURE
Traffic Signal - 086 West of Ferrari @ Concours St TS086 FUTURE
Traffic Signal - 087
Mercedes Ln/Ontario Ctr Pkwy @ Concours St
TS087 FUTURE
Traffic Signal -088 East of Haven @ Concours St TS088 FUTURE
Traffic Signal - 090 Haven Ave @ Concours St TS090 FUTURE
Traffic Signal - 091 Ferrari Ln @ Inland Empire Blvd TS091 FUTURE

City of Ontario, California
Fiber Optic Master Plan
80 | P a g e
NAME LOCATION
(N/S STREET / E/W STREET)
LABEL PHASE
Traffic Signal - 092 West of Ferrari @ Inland Empire Blvd TS092 FUTURE
Traffic Signal - 093 East of Mercedes @ Inland Empire Blvd TS093 FUTURE
Traffic Signal - 094 Mercedes Ln @ Inland Empire Blvd TS094 FUTURE
Traffic Signal - 095 Porsche Way @ Inland Empire Blvd TS095 FUTURE
Traffic Signal - 096 Haven Ave @ Inland Empire Blvd TS096 FUTURE
Traffic Signal - 097 Archibald Ave @ Mission Blvd TS097 FUTURE
Traffic Signal - 098 South of Jurupa St @ Archibald Ave TS098 FUTURE
Traffic Signal - 099 Turner Ave @ Jurupa St TS099 FUTURE
Traffic Signal - 100 West of Haven @ Jurupa St TS100 FUTURE
Traffic Signal -101 Haven Ave @ Jurupa St TS101 FUTURE
Traffic Signal - 102 Toyota Way @ Jurupa St TS102 FUTURE
Traffic Signal - 103 Auto Center Dr @ Jurupa St TS103 FUTURE
Traffic Signal - 104 Vintage Ave @ Jurupa St TS104 FUTURE
Traffic Signal - 105 Etiwanda Ave @ Jurupa St TS105 FUTURE
Traffic Signal - 106 Etiwanda Ave @ Santa Ana St TS106 FUTURE
Traffic Signal - 107 Etiwanda Ave @ Francis St TS107 FUTURE
Traffic Signal - 108 Business Pkwy @ Philadelphia St TS108 FUTURE
Traffic Signal - 109 Turner Ave @ Philadelphia St TS109 FUTURE
Traffic Signal - 110 Excise Ave @ Philadelphia St TS110 FUTURE
Traffic Signal - 111 Haven Ave @ Philadelphia St TS111 FUTURE
Traffic Signal - 112 Vineyard Ave @ 6th St TS112 FUTURE
Traffic Signal - 113 Vineyard Ave @ 8th St TS113 FUTURE
Traffic Signal - 114 Grove Ave @ 8th St TS114 FUTURE
Traffic Signal - 115 Sultana Ave @ Holt Blvd TS115 FUTURE
Traffic Signal - 116 Grove Ave @ D St TS116 FUTURE
Traffic Signal - 117 Grove Ave @ G St TS117 FUTURE
Traffic Signal - 118 Grove Ave @ I St TS118 FUTURE
Traffic Signal - 119 Grove Ave @ Fourth St TS119 FUTURE
Traffic Signal - 120 Grove Ave @ Princeton St TS120 FUTURE
Traffic Signal - 121 Grove Ave @ 7th St TS121 FUTURE
Traffic Signal - 122 Grove Ave @ 6th St TS122 FUTURE
Traffic Signal - 123 Corona Ave @ Fourth St TS123 FUTURE
Traffic Signal - 124 Baker Ave @ Fourth St TS124 FUTURE
Traffic Signal - 125 Vineyard Ave @ Holt Blvd TS125 FUTURE
Traffic Signal - 126 South of D St @ Vineyard Ave TS126 FUTURE
Traffic Signal - 127 East of Vineyard @ Holt Blvd TS127 FUTURE
Traffic Signal - 128 Guasti Rd @ Holt Blvd TS128 FUTURE
Traffic Signal - 129 Archibald Ave @ Guasti Rd TS129 FUTURE
Traffic Signal - 130 Archibald Ave @ Inland Empire Blvd TS130 FUTURE

City of Ontario, California
Fiber Optic Master Plan
81 | P a g e
NAME LOCATION
(N/S STREET / E/W STREET)
LABEL PHASE
Future Traffic Signal - 131
West of Turner @ Inland Empire Blvd TS131 FUTURE
Traffic Signal -132 Turner Ave @ Inland Empire Blvd TS132 FUTURE
Traffic Signal – 133 Shelby Ln @ Inland Empire Blvd TS133 FUTURE
Traffic Signal – 134 Center Ave @ Inland Empire Blvd TS134 FUTURE
Traffic Signal – 135 Haven Ave @ Guasti Rd TS135 FUTURE
Traffic Signal – 136 East of Haven Ave @ Guasti Rd TS136 FUTURE
Traffic Signal – 137 Commerce Pkwy @ Santa Ana St TS137 FUTURE
Traffic Signal – 138 Carnegie Ave @ Jurupa St TS138 FUTURE
Traffic Signal – 139 Commerce Pkwy @ Jurupa St TS139 FUTURE
Traffic Signal - 140 DuPont Ave @ Jurupa St TS140 FUTURE
Traffic Signal – 141 Haven Ave @ Francis St TS141 FUTURE
Traffic Signal - 142 Haven Ave @ Mission Blvd TS142 FUTURE
Future Traffic Signal - 143
Ontario Rd @ Riverside Dr TS143 FUTURE
Traffic Signal - 144 Vineyard Ave @ Mission Blvd TS144 FUTURE
Traffic Signal - 145 Baker Ave @ Mission Blvd TS145 FUTURE
Traffic Signal - 146 Grove Ave @ Belmont St TS146 FUTURE
Traffic Signal - 147 Grove Ave @ Acacia St TS147 FUTURE
Traffic Signal - 148 Grove Ave @ Philadelphia St TS148 FUTURE
Traffic Signal -149 South of Philadelphia @ Grove Ave TS149 FUTURE
Traffic Signal - 150 Cucamonga Ave @ Philadelphia St TS150 FUTURE
Traffic Signal - 151 Campus Ave @ Riverside Dr TS151 FUTURE
Traffic Signal - 152 Plum Ave @E Holt Blvd TS152 FUTURE
Traffic Signal - 153 Campus Ave @ Holt Blvd TS153 FUTURE
Traffic Signal - 154 Allyn Ave @ Holt Blvd TS154 FUTURE
Traffic Signal - 155 West of Corona @ Holt Blvd TS155 FUTURE
Traffic Signal - 156 Corona Ave @ Holt Blvd TS156 FUTURE
Traffic Signal - 157 Guasti Rd @ East of Archibald Ave TS157 FUTURE
Traffic Signal - 158 East of Barrington @ Ontario Mills Pkwy TS158 FUTURE
Traffic Signal - 159
At Ontario International Airport @ Terminal Way
TS159 FUTURE
Traffic Signal - 160
At Ontario International Airport @ Terminal Way
TS160 FUTURE
Traffic Signal - 161
At Ontario International Airport @ Terminal Way
TS161 FUTURE
Traffic Signal - 162
At Ontario International Airport @ Terminal Way
TS162 FUTURE
Traffic Signal - 163
At Ontario International Airport @ Terminal Way
TS163 FUTURE
Traffic Signal - 164
At Ontario International Airport @ Terminal Way
TS164 FUTURE
Traffic Signal - 165
At Ontario International Airport @ Terminal Way
TS165 FUTURE
Traffic Signal - 166
At Ontario International Airport @E Terminal Way
TS166 FUTURE
Traffic Signal - 167
At Ontario International Airport @ Terminal Way
TS167 FUTURE
Traffic Signal - 168 Philadelphia St @E Mission Blvd TS168 FUTURE
Traffic Signal - 169 Haven Ave @ Creekside Dr TS169 FUTURE

City of Ontario, California
Fiber Optic Master Plan
82 | P a g e
NAME LOCATION
(N/S STREET / E/W STREET)
LABEL PHASE
Traffic Signal - 170 Kaiser Dwy @ Philadelphia St TS170 FUTURE
Traffic Signal - 171 Vineyard Ave @ Philadelphia St TS171 FUTURE
Traffic Signal - 172 Raymond Kay Way @ Vineyard Ave TS172 FUTURE
Traffic Signal - 173 North of Banyan St @ Vineyard Ave TS173 FUTURE
Traffic Signal - 174 Vineyard Ave @ Walnut St TS174 FUTURE
Traffic Signal - 175 Grove Ave @ Walnut St TS175 FUTURE
Traffic Signal - 176 San Antonio Ave @ Philadelphia St TS176 FUTURE
Traffic Signal - 177 Mountain Ave @ Philadelphia St TS177 FUTURE
Traffic Signal - 178 Benson Ave @ Mission Blvd TS178 FUTURE
Traffic Signal - 179 San Antonio Ave @ Mission Blvd TS179 FUTURE
Traffic Signal - 180 Vine Ave @ Mission Blvd TS180 FUTURE
Traffic Signal - 181 San Antonio Ave @ Holt Blvd TS181 FUTURE
Traffic Signal - 182 Vine Ave @ Holt Blvd TS182 FUTURE
Traffic Signal - 183 Mountain Ave @ 6th St TS183 FUTURE
Traffic Signal - 184 Grove Ave @ Fifth St TS184 FUTURE
4.3. Traffic Signals – NMC
NAME LOCATION
(N/S STREET / E/W STREET)
LABEL
PHASE
Traffic Signal - 185 Grove Ave @ Riverside Dr TS185
NMC
FUTURE
Traffic Signal - 186 Vineyard Ave @ Riverside Dr TS186
NMC
FUTURE
Traffic Signal -187 South of Chino Ave @ Hammer Ave TS187
NMC
FUTURE
Traffic Signal - 188 North of Edison Ave @ Hammer Ave TS188
NMC
FUTURE
Traffic Signal - 189 Hammer Ave @ Edison Ave TS189
NMC
FUTURE
Future Traffic Signal - 190 Walker Ave @ Riverside Dr TS190
NMC
FUTURE
Future Traffic Signal - 191 Ontario Rd @ Chino Ave TS191
NMC
FUTURE
Future Traffic Signal - 192 Ontario Rd @ Schafer Ave TS192
NMC
FUTURE
Future Traffic Signal - 193
Cucamonga Creek Channel Wash @ Edison
Ave
TS193
NMC
FUTURE
Future Traffic Signal - 194 East of Carpenter @ Eucalyptus Ave TS194
NMC
FUTURE
Future Traffic Signal - 195 East of Carpenter @ Merrill Ave TS195
NMC
FUTURE
Future Traffic Signal - 196 Vineyard Ave @ Merrill Ave TS196
NMC
FUTURE
Future Traffic Signal - 197 Grove Ave @ Merrill Ave TS197
NMC
FUTURE

City of Ontario, California
Fiber Optic Master Plan
83 | P a g e
NAME LOCATION
(N/S STREET / E/W STREET)
LABEL
PHASE
Future Traffic Signal - 198 Campus Ave @ Merrill Ave TS198
NMC
FUTURE
Future Traffic Signal - 199 Archibald Ave @ Merrill Ave TS199
NMC
FUTURE
Future Traffic Signal – 200 Sumner Ln @ Remington Ave TS200
NMC
FUTURE
Future Traffic Signal - 201 Cleveland Ave @ Remington Ave TS201
NMC
FUTURE
Future Traffic Signal - 202 Milliken Ave @ Remington Ave TS202
NMC
FUTURE
Future Traffic Signal – 203 Hammer Ave @ Eucalyptus Ave TS203
NMC
FUTURE
4.4. Well Aggregation Sites
WELL NO PHASE
WELL # 17 FUTURE
WELL # 27 FUTURE
WELL # 36 FUTURE
WELL # 46 FUTURE
WELL # 47 FUTURE
WELL # 20 FUTURE
WELL # 25 FUTURE
WELL # 29 FUTURE
WELL # 30 FUTURE
WELL # 31 FUTURE
WELL # 35 FUTURE
WELL # 39 FUTURE
WELL # 40 FUTURE
WELL # 41 FUTURE
WELL # 44 FUTURE
WELL # 16 FUTURE - LATERAL RUNS BY
WELL # 24 FUTURE - LATERAL RUNS BY
WELL # 26 FUTURE - LATERAL RUNS BY
WELL # 38 FUTURE - LATERAL RUNS BY
WELL # 49 FUTURE - LATERAL RUNS BY
WELL # 52 FUTURE - LATERAL RUNS BY
4.5. CIP Projects
ROUTE
DESCRIPTION
CIP
DESCRIPTION
CIP
NUMBER
LOCATION PHASE

City of Ontario, California
Fiber Optic Master Plan
84 | P a g e
ROUTE
DESCRIPTION
CIP
DESCRIPTION
CIP
NUMBER
LOCATION PHASE
Lateral
City Water MOID P22708
Vesta St East of Boulder Ave. FUTURE
Lateral
City Water MOID P26906
Vesta St East of Boulder Ave FUTURE
Lateral
City Water MOID P22707
Vesta St West of San Antonio Ave FUTURE
Lateral
City Water MOID P24956
Vesta St West of Cone Flower FUTURE
Lateral
City Water MOID P26753
Vesta St East of Mountain Ave FUTURE
Lateral
City Water MOID P24281
Vesta St East of Mountain Ave FUTURE
Lateral City Water MOID P-106
8th St between Campus Ave and
Virginia Ave
FUTURE
Lateral City Water MOID P7805 Grove Ave North of 8th St FUTURE
Lateral City Water MOID P11799
8th St between Sacramento Ave and
San Diego Ave
FUTURE
Lateral City Water MOID P798
8th St between San Diego Ave and
Vineyard Ave
FUTURE
Lateral City Water MOID P6170
8th St between Placer Ave and
Sacramento Ave
FUTURE
Lateral City Water MOID P11553
8th St between Grove Ave and
Amador Ave
FUTURE
Lateral City Water MOID P11556
8th St between Amador Ave and
Calaveras Ave
FUTURE
Lateral City Water MOID P11565
8th St between Calaveras Ave and
Del Norte Ave
FUTURE
Lateral City Water MOID P1387
8th St between Del Norte Ave and El
Dorado Ave
FUTURE
Lateral City Water MOID P10284
8th St between El Dorado Ave and
Glen Ave
FUTURE
Lateral City Water MOID P11669
8th St. between Glen Ave and
Humboldt Ave
FUTURE
Lateral City Water MOID P11673
8th St between Lake Ave and Baker
Ave
FUTURE
Lateral City Water MOID P11681
8th St between Lake Ave and Baker
Ave
FUTURE
Lateral City Water MOID P11674 8th St East of Baker Ave. FUTURE
Lateral City Water MOID P11704
8th St between Baker Ave and
Madera Ave.
FUTURE
Lateral City Water MOID P11708
8th St between Madera Ave and
Marin Ave
FUTURE
Lateral City Water MOID P9668 8th St West of Orange Ave FUTURE
Lateral City Water MOID P1389
8th St between Orange Ave and
Placer Ave
FUTURE
Lateral City Water MOID P11712
8th St between Marin Ave and
Orange Ave
FUTURE
Lateral City Water MOID P7812
8th St between Virginia Ave and
Grove Ave
FUTURE
Lateral City Water MOID P-49
8th St between Campus Ave and
Virginia Ave
FUTURE
Lateral City Water MOID P29490
8th St between Campus Ave and
Virginia Ave
FUTURE
Lateral City Water MOID P7807 Grove Ave North of 8th St FUTURE
Lateral City Water MOID P7815 Grove Ave North of 8th St FUTURE
Lateral City Water MOID P25853 B St East of Laurel Ave FUTURE

City of Ontario, California
Fiber Optic Master Plan
85 | P a g e
ROUTE
DESCRIPTION
CIP
DESCRIPTION
CIP
NUMBER
LOCATION PHASE
Lateral City Water MOID P26938 B St East of Palm Ave. FUTURE
Lateral City Water MOID P26941 B St East of Fern Ave. FUTURE
Lateral City Water MOID P26848 B S. East of Vine Ave. FUTURE
Lateral City Water MOID P23499
Mission Blvd East of Greenwood
Ave
FUTURE
Lateral City Water MOID P25816 Transit St East of Euclid Ave FUTURE
Lateral City Water MOID P25815 Transit St East of Euclid Ave FUTURE
Lateral City Water MOID P25814 Transit St East of Laurel Ave FUTURE
Lateral City Water MOID P22286 Laurel Ave South of Transit St. FUTURE
Lateral City Water MOID P26518
Laurel Ave between Emporia St and
Transit St
FUTURE
Lateral City Water MOID P27476
Emporia St between Palm Ave and
Laurel Ave
FUTURE
Lateral City Water MOID P25911
Oaks Ave South of Francis St and
North of Philadelphia St.
FUTURE
Lateral City Water MOID P27341 Oaks Ave North of Philadelphia St. FUTURE
Lateral City Water MOID P29118 Oaks Ave South of Francis St FUTURE

City of Ontario, California
Fiber Optic Master Plan
86 | P a g e
5. Fiber Optic Design Submittal Checklist
As referenced in the Fiber Optic Design Guidelines, the following is the itemized checklist
required to be completed by an Engineer when submitting plans:
Item Yes No N/A
I. All Sheets
1.
Plans are in waterproof ink on Mylar sheets
2.
Plan sheets are 24 inch X 36 inch with the Standard City Title Block
3.
Sticky backs or paste-ons are not used
4.
Signed by the Engineer-of-Work
5.
Marked with the name, address and telephone number of the firm preparing the
plans and date of preparation
6.
Consecutively numbered and the total number of sheets
7.
Lettered in a neat and legible style, no hand lettering smaller than 1/8” and no
machine letter smaller than 1/10”
8.
Name and phase of development. Street names and construction station limits
9.
Clearly designate between existing conditions (dashed) and work proposed
(solid)
10.
Note all reference drawings on plans
11.
Title block w/ “Fiber Optic Conduit Plan” (top line), street names (2
nd
line), and
limits of construction “From street intersection to XXX’ N,S,E,W” (3
rd
line)
12.
Standard drawing and title block per City Std 6004
13.
Show all existing and proposed easements. Clearly indicate public or private
14.
Review Fiber Optic Master Plan study for locations and details
15.
Compare to conditions of approval and approved maps
II. Title Sheet
16.
Heading “Fiber Optic Plans for ________ in the City of Ontario”
17.
Consultant recommendation for acceptance block (public facilities only)
18.
Standard general notes and construction notes provided. Construction notes
match plans
19.
Additional notes are designated as “Special Notes”
20.
Basis of bearing provided
21.
Index Map (scale 1”=100’ or 1”=500’, sheet coverage shown, located on title
sheet, street names shown, identify areas in County)

City of Ontario, California
Fiber Optic Master Plan
87 | P a g e
Item Yes No N/A
22.
Vicinity Map (orient north as on key map, arterial streets shown, project
boundary street shown)
23.
Legend (symbols per City Std 6002-6003, non-standard symbols and
abbreviations used are listed and described)
24.
Underground service alert information at bottom left corner
25.
Owners/Developers name and address shown
26.
Separate written justification for deviations provided
27.
Quantity estimates provided and broken out between public/private & per tract if
multi-tract project
28.
All reference drawings listed
III. Fiber Optic Plans
29.
North arrow generally up or to the right
30.
Plan scale should be either 1”=40’ or 1”=20’ for clarity purposes
31.
Label property & boundary lines
32.
Identify area located in County or adjoining City
33.
Approved name of streets shown
34.
Stations along the centerline to match existing
35.
New stationing to increase W to E or S to N except where street ends in W’ly or
S’ly dead-end or cul-de-sac
36.
Dimension and label existing and proposed right-of-way lines
37.
Dimension and label right-of-way to centerline
38.
Dimension and label curb to curb
39.
Dimension and label curb to centerline
40.
Dimension and label centerline of street to centerline of all utilities (existing and
proposed). Also, include dimensions from curb face to centerline of all utilities
dimensions.
41.
Show and label existing power poles, trees, fire hydrants, pipelines, irrigation
lines, or structures, etc. in right-of-way or immediately adjacent to right-of-way
42.
Stations at beginning, end or change in Fiber Optic Line
43.
Stations at each pull-box, hand hole, or flower pot
44.
Station CL of driveways, curb inlets, etc.
45.
Intersecting street centerline stations
46.
If more than one sheet, match line with station and reference sheet
47.
Show existing improvements as dashed lines

City of Ontario, California
Fiber Optic Master Plan
88 | P a g e
Item Yes No N/A
48.
Show existing elevations (as necessary) within parenthesis
49.
Reference drawing numbers provided
50.
Notes for connections to existing Fiber Optic Line
51.
Construction notes and #s with Standard Drawings called out on each sheet.
Only construction notes applied to the sheet are shown.
52.
Details for improvements that are not Standard Drawings
53.
Typical sections, including utility locations, in conformance with Standard
Drawings.
54.
Number and sizes of conduits are in accordance with Fiber Optic Master Plan
55.
Improvement plans conform to conditions of approval
56.
Improvement plans consistent with grading plan, final map and other existing
plans
57.
Compare design to existing plans (if any)

City of Ontario, California
Fiber Optic Master Plan
89 | P a g e
APPENDIX B – DETAILED BUDGETS
Figure 25 - Infrastructure Budget - Phase 1
Descriptions Service Drops POP Facility
New
Construction
Existing
System
Totals
PM, Engineering & Install
Totals
71
2
57,820 ft
35,952 ft
Program Management 4,800.00$ 21,200.00$ 76,000.00$ 7,000.00$ 109,000.00$
Project Management 4,800.00$ 20,000.00$ 60,000.00$ 7,000.00$ 91,800.00$
Meetings / Status Updates -$ 1,200.00$ 8,000.00$ -$ 9,200.00$
Travel / Expense -$ -$ 8,000.00$ -$ 8,000.00$
OSP Design 170,920.00$ -$ 172,880.89$ 33,575.84$ 377,376.73$
Plan Review 520.00$ -$ 2,312.79$ 719.04$ 3,551.83$
Field Design 142,000.00$ -$ 75,165.61$ 14,380.80$ 231,546.41$
Network Design 14,200.00$ -$ 57,819.70$ -$ 72,019.70$
Final Design 14,200.00$ -$ 23,127.88$ 17,976.00$ 55,303.88$
Permit Development -$ -$ 14,454.92$ 500.00$ 14,954.92$
Network Equipment Installation 82,300.00$ -$ -$ -$ 82,300.00$
Equipment Design 21,300.00$ -$ -$ -$ 21,300.00$
Distribution Ring Provisioning 45,000.00$ -$ -$ -$ 45,000.00$
Content Provider Network Setup 6,000.00$ -$ -$ -$ 6,000.00$
Provider Inter-Connect & Testing 10,000.00$ -$ -$ -$ 10,000.00$
NOC Implementation 8,200.00$ -$ -$ -$ 8,200.00$
Network Equipment NOC Setup 4,000.00$ -$ -$ -$ 4,000.00$
Facilities NOC Setup 4,000.00$ -$ -$ -$ 4,000.00$
Emergency Response Testing 200.00$ -$ -$ -$ 200.00$
System Provisioning 3,500.00$ -$ -$ -$ 3,500.00$
System Provisioning 3,000.00$ -$ -$ -$ 3,000.00$
Distribution Route Testing 500.00$ -$ -$ -$ 500.00$
Engineering / Operations Sub-Totals
269,720.00$ 21,200.00$ 248,880.89$ 40,575.84$ 580,376.73$
Construction
Facilities Development 497,028.64$ 336,255.28$ -$ -$ 833,283.92$
Site Design -$ 20,000.00$ -$ -$ 20,000.00$
City Hall Upgrades -$ 8,973.28$ -$ -$ 8,973.28$
NMC EAST - Riverside Facility -$ 190,842.00$ -$ -$ 190,842.00$
Equipment Procurement 497,028.64$ -$ -$ 497,028.64$
OMC EAST - City Arena -$ 115,440.00$ -$ -$ 115,440.00$
Site Acceptance Testing -$ 1,000.00$ -$ -$ 1,000.00$
Construction Installation 174,966.48$ -$ 3,027,762.15$ 515,152.52$ 3,717,881.16$
Instrastructure Cost -$ 2,075,444.46$ 268,801.10$ 2,344,245.56$
Fiber System Cost -$ 724,140.69$ 246,351.43$ 970,492.12$
Traffic-Water Interconnections 228,177.00$ 228,177.00$
Building Entrance Links 174,966.48$ 174,966.48$
Construction Sub-Totals
671,995.12$ 336,255.28$ 3,027,762.15$ 515,152.52$ 4,551,165.07$
Phase I Totals 941,715.12$ 357,455.28$ 3,276,643.05$ 555,728.36$ 5,131,541.80$
941,715.12$
357,455.28$
3,276,643.05$
555,728.36$
5,131,541.80$
City of Ontario Infrastructure Budget
Phase I
Project Captial Total (Phase I)
City of Ontario Budget Summary
Building Entrance Connections
Facility Construction
New Route Construction
Existing Conduit System

City of Ontario, California
Fiber Optic Master Plan
90 | P a g e
Figure 26 - Core Electronics – Phase 1
Product Item Qnty Cost Ext Cost
POP SWITCH CHASSIS 3 32,171.75$ 96,515.25$
POP SWITCH MGMT MODULE 3 5,200.00$ 15,600.00$
POP SWITCH INTERNAL MODULE 3 6,951.75$ 20,855.25$
POP SWITCH TRANSPORT MODULE 3 25,996.75$ 77,990.25$
POP SWITCH DISTRIBUTION MODULE 3 11,696.75$ 35,090.25$
POP SWITCH POWER 6 2,141.75$ 12,850.50$
POP SWITCH POWER CORD 6 21.45$ 128.70$
POP SWITCH WARRANTY 15 7,507.50$ 112,612.50$
TRANSPORT OPTICS 6 1,784.25$ 10,705.50$
DISTRIBUTION OPTICS 6 890.50$ 5,343.00$
ACCESS SWITCH 3 10,721.75$ 32,165.25$
ACCESS SWITCH SOFTWARE 3 1,946.75$ 5,840.25$
ACCESS SWITCH POWER 6 419.25$ 2,515.50$
ACCESS SWITCH OPTICS 3 4,546.75$ 13,640.25$
ACCESS SWITCH WARRANTY 15 867.75$ 13,016.25$
ACCESS SWITCH UPLINK OPTICS 6 890.50$ 5,343.00$
Tax (8.0%) 36,816.94$
Total Capital Equipment Budget 497,028.64$
City of Ontario
Capital Equipment Budget
Phase I

City of Ontario, California
Fiber Optic Master Plan
91 | P a g e
Facilities – Phase 1
Figure 27 - POP Details - NMC EAST
PROJECT
LOCATION
Work Item
1. Project Management 6,500$
2. Real Estate Services -$
3. Design and Permitting -$
Allowance -$
4. Site Work 2,500$
5. On-site Foundations -$
6. Delivery, Crane and Assembly -$
7. Speciality Systems -$
Cable Management 2,730$
Fencing, Partitions 3,060$
8. On-site Architectural Enhancements 3,000$
9. On-site Mechanical and Electrical
A. Electrical (exterior): 8,997$
B. Electrical (interior): 2,532$
C. HVAC: 40,440$
E. Plumbing: 1,560$
D. Fire Protection: 8,118$
F. Controls and automation: -$
10. On-Site Accessories -$
11. Equipment - 20kW generator -$
11. Equipment - Power System 52,668$
12. Racking, Cabinets 47,850$
13. Maintenance -$
14. Use Tax / Sales Tax 10,887$
190,842$
Facility Retofit
NMC EAST - Riverside Facility
TOTAL

City of Ontario, California
Fiber Optic Master Plan
92 | P a g e
Facilities – Phase 1
Figure 28 - POP Details - OMC EAST / NMC WEST (Future)
PROJECT
LOCATION(s)
Work Item
1. Project Management 3,000$
2. Real Estate Services -$
3. Design and Permitting 1,500$
Allowance 2,000$
4. Site Work - level grade and 3" of gravel 4,000$
5. On-site Foundations 4,700$
6. Delivery, Crane and Assembly 9,252$
7. Precast Structure 48,000$
Freight 5,350$
Insepection Services 400$
8. On-site Architectural Enhancements 3,000$
9. On-site Mechanical and Electrical
A. Electrical (exterior): 3,500$
B. Electrical (interior): Included
C. HVAC: Included
E. Plumbing: n/a
D. Fire Protection: 8,118$
F. Controls and automation: -$
10. On-Site Accessories -$
11. Equipment - 20kW generator -$
11. Equipment - Power System 13,500$
12. Racking, Cabinets 4,200$
13. Maintenance -$
14. Use Tax / Sales Tax 4,920$
115,440$ TOTAL PER SITE
Pre-Cast Building 12x16
OMC EAST (City Arena) / NMC WEST (Cent. Park)

City of Ontario, California
Fiber Optic Master Plan
93 | P a g e
Building Entrance Links – Phase 1
Figure 29 - Building Entrance Links - Phase 1
Descriptions
Building Entrance Construction
Building Connection
Trenching - Conduit Install 200 ' 7.00$ 1,400.00$
Cable Construction 200 ' 1.18$ 236.00$
CPE Procurement 1 3,600.00$ 3,600.00$
Equipment Installation 1 45.00$ 45.00$
Splice Case 1 350.00$ 350.00$
Splicing, Testing & Patch 4 40.00$ 160.00$
Termination Panel 1 200.00$ 200.00$
Equipment Provisioning 4 60.00$ 240.00$
6,231.00$
Tax (8.0%) 498.48$
Building Entrance Link Total 6,729.48$
26
Total BEL Construction 174,966.48$
Building Entrances
Conduit Installation
Placed Drop Conduit, Pull Drop
12 Port Gig Switch
Install conduit
City of Ontario
Building Entrance Construction Budget
Phase I

City of Ontario, California
Fiber Optic Master Plan
94 | P a g e
Traffic & Water Interconnections – Phase 1
Figure 30 - Traffic & Water Interconnections – Phase 1
Descriptions
Traffic & Water Construction
Customer Installation (Commercial)
Trenching - Conduit Install 80 ' 4.00$ 320.00$
Cable Construction 1 ' 900.00$ 900.00$
CPE Procurement 1 2,500.00$ 2,500.00$
Equipment Installation 1 45.00$ 45.00$
Splice Case 1 350.00$ 350.00$
Splicing, Testing & Patch 4 40.00$ 160.00$
Gator Patch 1 300.00$ 300.00$
Equipment Provisioning 2 60.00$ 120.00$
4,695.00$
Tax (8.0%) 375.60$
Device Connection Total 5,070.60$
45
Total Traffic Construction 228,177.00$
Connections
Conduit Installation
Install conduit
Handhole Placement, Sweeps
Westell Switch
City of Ontario
Traffic & Water Connection Construction Budget
Phase I
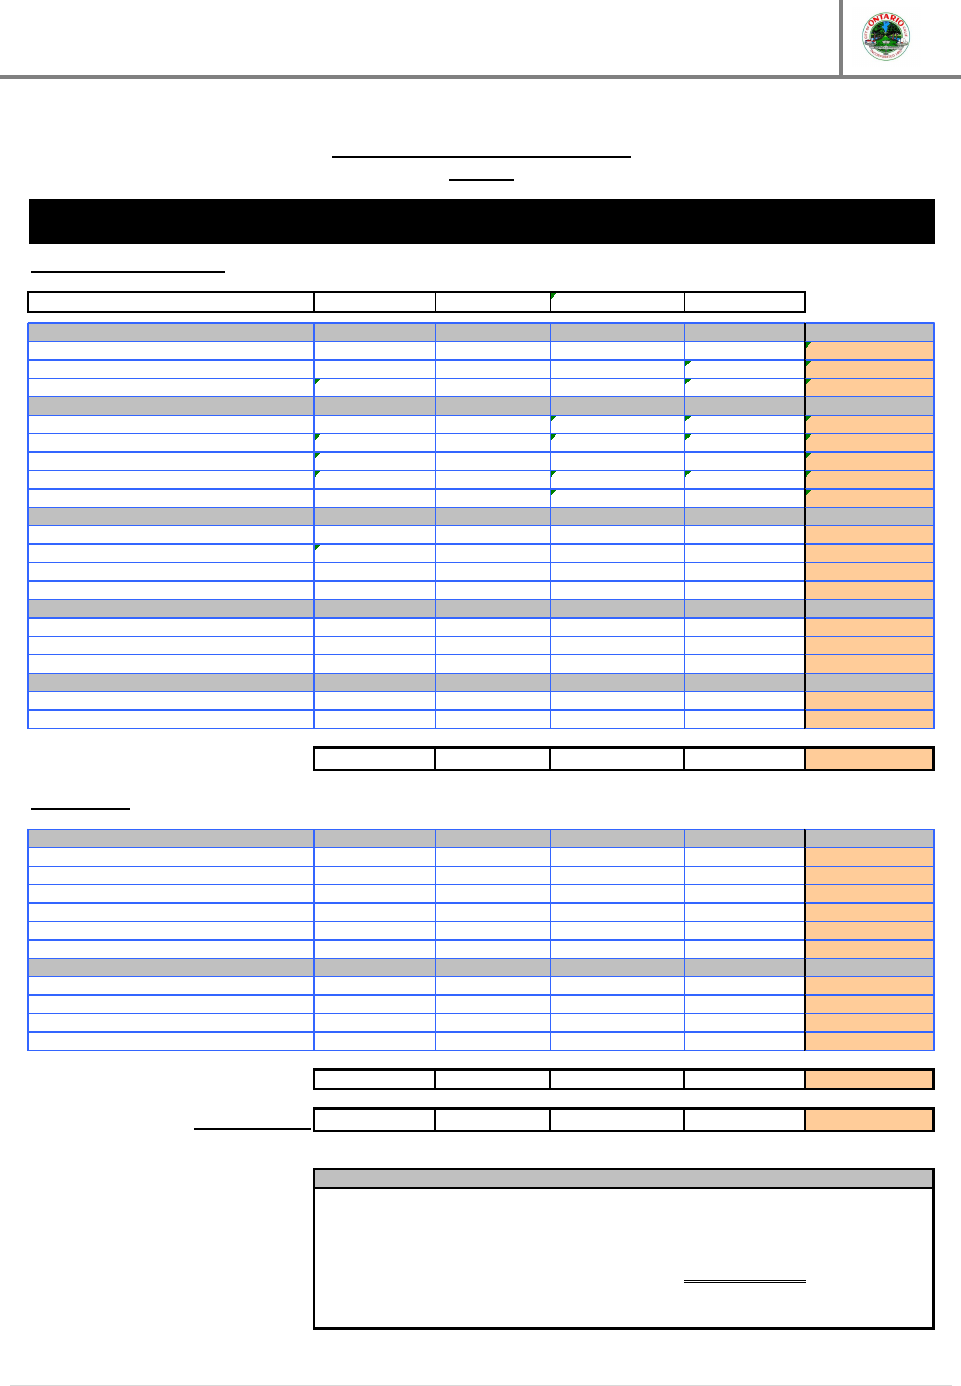
City of Ontario, California
Fiber Optic Master Plan
95 | P a g e
Figure 31 - Infrastructure Budget - Phase 2
Descriptions
Building
Entrance
Facility
New
Construction
Existing
System
Totals
PM, Engineering & Install
Totals
0
n/a
41,308 ft
ft
Program Management -$ -$ 46,000.00$ -$ 46,000.00$
Project Management -$ -$ 36,000.00$ -$ 36,000.00$
Meetings / Status Updates -$ -$ 5,000.00$ -$ 5,000.00$
Travel / Expense -$ -$ 5,000.00$ -$ 5,000.00$
OSP Design -$ -$ 84,682.25$ -$ 84,682.25$
Plan Review -$ -$ 2,065.42$ -$ 2,065.42$
Field Design -$ -$ 57,831.78$ -$ 57,831.78$
Network Design -$ -$ -$ -$ -$
Final Design -$ -$ 16,523.37$ -$ 16,523.37$
Permit Development -$ -$ 8,261.68$ -$ 8,261.68$
Network Equipment Installation -$ -$ -$ -$ -$
Equipment Design -$ -$ -$ -$ -$
Distribution Ring Provisioning -$ -$ -$ -$ -$
Content Provider Network Setup -$ -$ -$ -$ -$
Provider Inter-Connect & Testing -$ -$ -$ -$ -$
NOC Implementation -$ -$ -$ -$ -$
Network Equipment NOC Setup -$ -$ -$ -$ -$
Facilities NOC Setup -$ -$ -$ -$ -$
Emergency Response Testing -$ -$ -$ -$ -$
System Provisioning -$ -$ -$ -$ -$
System Provisioning -$ -$ -$ -$ -$
Distribution Route Testing -$ -$ -$ -$ -$
Engineering/Opertations SubTotals
-$ -$ 130,682.25$ -$ 130,682.25$
Construction
Facilities Development 34,871.85$ -$ -$ -$ 34,871.85$
Site Design -$ -$ -$ -$ -$
Mechanical Systems -$ -$ -$ -$ -$
Electrical Systems -$ -$ -$ -$ -$
Equipment Procurement 34,871.85$ -$ -$ -$ 34,871.85$
Specialty Systems -$ -$ -$ -$ -$
Site Acceptance Testing -$ -$ -$ -$ -$
Construction Installation 55,928.88$ -$ 1,467,937.99$ -$ 1,523,866.87$
Instrastructure Cost -$ -$ 1,065,837.66$ -$ 1,065,837.66$
Fiber System Cost -$ -$ 340,383.73$ -$ 340,383.73$
Traffic-Water Interconnections -$ -$ 61,716.60$ -$ 61,716.60$
Building Entrance Links 55,928.88$ -$ -$ -$ 55,928.88$
Construction SubTotals
90,800.73$ -$ 1,467,937.99$ -$ 1,558,738.72$
Phase II Totals 90,800.73$ -$ 1,598,620.24$ -$ 1,689,420.97$
90,800.73$
-$
1,598,620.24$
-$
1,689,420.97$
City of Ontario Infrastructure Budget
Phase II
Project Captial Total (Phase II)
City of Ontario Budget Summary
Building Entrance Connections
Facility Construction
New Route Construction
Existing Conduit System

City of Ontario, California
Fiber Optic Master Plan
96 | P a g e
Electronics – Phase 2
Figure 32 - Electronics - Phase 2
Capital Equipment Budget
Product Item Qnty Cost Ext Cost
TRANSPORT OPTICS 2 1,784.25$ 3,568.50$
DISTRIBUTION OPTICS 0 890.50$ -$
ACCESS SWITCH 1 10,721.75$ 10,721.75$
ACCESS SWITCH SOFTWARE 1 1,946.75$ 1,946.75$
ACCESS SWITCH POWER 2 419.25$ 838.50$
ACCESS SWITCH OPTICS 2 4,546.75$ 9,093.50$
ACCESS SWITCH WARRANTY 5 867.75$ 4,338.75$
ACCESS SWITCH UPLINK OPTICS 2 890.50$ 1,781.00$
Tax (8.0%) 2,583.10$
Total Capital Equipment Budget 34,871.85$
City of Ontario
Phase II
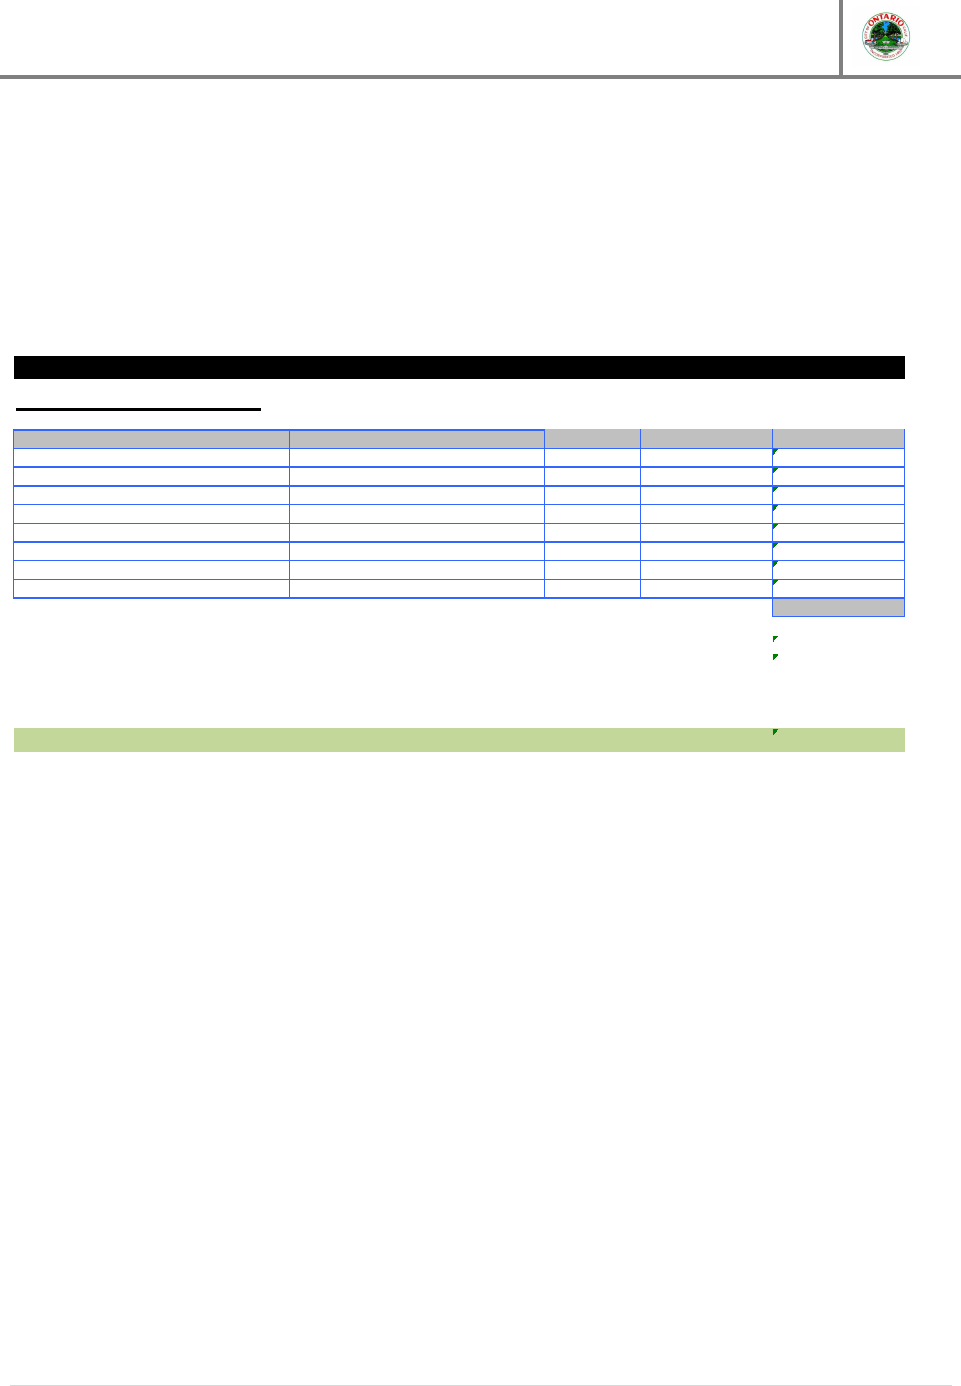
City of Ontario, California
Fiber Optic Master Plan
97 | P a g e
Building Entrance Links – Phase 2
Figure 33 - Building Entrance Links - Phase 2
Descriptions
Building Entrance Construction
Building Connection
Trenching - Conduit Install 200 ' 7.00$ 1,400.00$
Cable Construction 200 ' 1.18$ 236.00$
CPE Procurement 1 3,600.00$ 3,600.00$
Equipment Installation 1 45.00$ 45.00$
Splice Case 1 350.00$ 350.00$
Splicing, Testing & Patch 4 40.00$ 160.00$
Termination Panel 1 200.00$ 200.00$
Equipment Provisioning 4 60.00$ 240.00$
6,231.00$
Tax (8.0%) 498.48$
Building Entrance Link Total 6,729.48$
6
Total BEL Construction 40,376.88$
City of Ontario
Building Entraces
Conduit Installation
Install conduit
Placed Drop Conduit, Pull Drop
12 Port Gig Switch
Building Entrance Construction Budget
Phase II

City of Ontario, California
Fiber Optic Master Plan
98 | P a g e
Traffic & Water Interconnections – Phase 2
Figure 34 - Traffic & Water Interconnections - Phase 2
Descriptions
Traffic & Water Construction
Customer Installation (Commercial)
Trenching - Conduit Install 80 ' 4.00$ 320.00$
Cable Construction 1 ' 900.00$ 900.00$
CPE Procurement 1 2,500.00$ 2,500.00$
Equipment Installation 1 45.00$ 45.00$
Splice Case 1 350.00$ 350.00$
Splicing, Testing & Patch 4 40.00$ 160.00$
Gator Patch 1 300.00$ 300.00$
Equipment Provisioning 2 60.00$ 120.00$
4,695.00$
Tax (8.0%) 375.60$
Device Connection Total 5,070.60$
11
Total Traffic Construction 55,776.60$
City of Ontario Budget
Connections
Conduit Installation
Install conduit
Handhole Placement, Sweeps
Westell Switch
Traffic & Water Connnection Construction Budget
Phase II
