Disclaimer
This non-paper from the Commission services is for information and discussion purposes only. It
may not be interpreted as stating an official position of the European Commission.
EFFECTS ANALYSIS (EA) ON THE
EUROPEAN DEPOSIT INSURANCE SCHEME (EDIS)
Contents
1. CONTEXT OF THE EFFECTS ANALYSIS (EA) ................................................................ 6
2. THE EXISTING FRAMEWORK FOR DGS IN THE EUROPEAN UNION ....................... 7
3. EFFECTS ANALYSIS OF THE MAIN POLICY OPTIONS ................................................ 9
3.1. The design of a pan-European deposit insurance scheme ............................................. 9
3.2. Policy options for risk and governance pooling ......................................................... 10
Mandatory reinsurance ................................................................................ 12 3.2.1.
Mandatory lending ....................................................................................... 13 3.2.2.
Fully mutualised fund .................................................................................. 15 3.2.3.
3.3. The incentive structure: moral hazard and risk reduction ........................................... 16
3.4. Comparing the three policy options ............................................................................ 17
Assessing risk absorption via SYMBOL ..................................................... 18 3.4.1.
Assessing diversification of risks under the three alternative 3.4.2.
arrangements ................................................................................................ 27
Assessing the implications of interconnection among EU banks ................ 28 3.4.3.
Benchmarking policy options ...................................................................... 29 3.4.4.
4. THE TRANSITIONAL PERIOD: THE RATIONALE BEHIND THE 'THREE-STAGE
APPROACH' ......................................................................................................................... 33
The transition under the Commission proposal ........................................... 33 4.1.1.
Analysis of uncovered liquidity and uncovered losses in the transition 4.1.2.
period via SYMBOL.................................................................................... 34
Key results ................................................................................................... 34 4.1.3.
Funding path ................................................................................................ 35 4.1.4.
5. INTERACTION BETWEEN EDIS AND NATIONAL DISCRETIONS UNDER THE
DGSD .................................................................................................................................... 39
5.1. Irrevocable payment commitments (IPC) ................................................................... 39
Issue description .......................................................................................... 39 5.1.1.
Policy options and comparison .................................................................... 39 5.1.2.
Conclusion ................................................................................................... 42 5.1.3.
5.2. Temporary high balances (THB) ................................................................................ 42
Issue description .......................................................................................... 42 5.2.1.
Policy options and comparison .................................................................... 43 5.2.2.
2
Conclusion ................................................................................................... 44 5.2.3.
5.3. Scope of EDIS ............................................................................................................ 44
Non-CRR entities ......................................................................................... 45 5.3.1.
Third-country branches ................................................................................ 47 5.3.2.
5.4. EDIS cover in case of alternative and preventive measures ....................................... 51
Issue description .......................................................................................... 51 5.4.1.
Policy options and comparison .................................................................... 54 5.4.2.
Conclusion ................................................................................................... 55 5.4.3.
5.5. Contributions .............................................................................................................. 56
Issue description .......................................................................................... 56 5.5.1.
Policy options and comparison .................................................................... 56 5.5.2.
Conclusion ................................................................................................... 57 5.5.3.
6. ANNEXES............................................................................................................................. 59
6.1. Modelling expected losses for EDIS vs other risk pooling models ............................ 59
6.2. Brief description of the data sample and the simulation exercise in SYMBOL ......... 62
6.3. Brief description of SYMBOL.................................................................................... 63
6.4. Outputs on payout analysis via SYMBOL .................................................................. 68
6.5. Outputs on the effectiveness of a fully-mutualised EDIS relative to national-level
DGS, via SYMBOL .................................................................................................... 83
6.6. Outputs on payout analysis on the transitional period via SYMBOL ......................... 89
6.7. List of European banking groups in the CDS premia analysis ................................... 92
6.8. Outputs of the CDS spread analysis ............................................................................ 93
3
DISCLAIMER
This non-paper from the Commission services is for information and discussion purposes
only. It may not be interpreted as stating an official position of the European Commission.
EXECUTIVE SUMMARY
On 24 November 2015 the Commission adopted a proposal for a European Deposit Insurance Scheme
(EDIS). The Commission considered the 2010 impact assessment, leading to the adoption of the
current Deposit Guarantee Scheme Directive (DGSD), as a solid basis for the EDIS proposal with the
same 0.8% target level than the current DGSD. This effects analysis complements the impact
assessment for the DGSD.
This paper analyses the effects of three options for the set up of deposit insurance within the Banking
Union. In addition it analyses the effects of different options on a number of more specific issues in
the design of EDIS.
Effects of different options for deposit insurance in the Banking Union
Policy options. Three mandatory approaches have been considered: mandatory reinsurance,
mandatory lending and a mutualised fund. The mandatory reinsurance model is assessed as a steady-
state option on the basis of different levels of distribution of resources between national DGSs and the
European reinsurer, plus different caps for uncovered liquidity and losses for the European reinsurer.
The mandatory lending model requires participating DGSs to provide up to 0.5% of covered deposits
to cover the liquidity shortfall. As all loans must be repaid in full by the borrowing DGS, the lending
DGS does not incur any loss. The fully mutualised fund, which is the steady state under the EDIS
proposal, replaces national DGS in providing full liquidity and absorbing any loss. The co-insurance
model under the EDIS proposal was not specifically tested, as it is only a variation of the mandatory
re-insurance model (with participation from the first euro of loss) and because the EDIS proposal only
envisaged it as a transitory stage to a fully mutualised fund.
An EU solution. By analysing stressed scenarios for 99.8% of EU-bank assets, the non-paper shows
that, under all three options, pooling risk delivers in every circumstance a significantly stronger
deposit guarantee system than a system of purely national schemes with voluntary lending. The
expected shortfall of a single scheme is lower than that of multiple national schemes.
The three policy options are tested against three criteria:
1. Risk absorption;
2. Efficiency and cost neutrality; and
3. Limits on moral hazard.
Risk absorption. The mutualised fund (EDIS) performs better than the mandatory re-insurance and
lending schemes in all the simulations, both in providing liquidity and absorbing losses. In terms of
liquidity, the mutualised fund makes available more funds, as compared to the other options. In terms
of loss absorption, the probability of remaining losses after recovery in insolvency/resolution
proceedings, implying failure of the DGS itself, is the smallest under the fully mutualised fund, as
extraordinary contributions are used to cover losses, as opposed to mandatory lending where national
DGSs fully bear the losses, as they receive funds in the form of loans.
4
Mandatory reinsurance outperforms mandatory lending with respect to liquidity and losses, even
when its caps are low and it performs close to the mutualised fund without caps. The fully mutualised
fund (EDIS) also offers greater risk diversification (portfolio effects), which minimises the expected
losses for the whole financial system in case of an asymmetric shock. Indeed, EDIS requires a risk-
based contribution from each participating bank calculated relative all other banks in the Banking
Union rather than a risk-based contribution calculated only relative to other banks in the same
national banking system.
Moreover, there is strong interconnection between the probabilities of default of all banks within the
Banking Union, also across borders. As a consequence, a national DGS cannot be fully insulated from
developments in a DGS in another Member State, which is unable to withstand a shock in its local
banking system. In a system of single DGSs, this implicit risk would need to be made explicit by
obliging banks to pay for it within a two-tier system of risk-based contributions: a bank-level
contribution to account for idiosyncratic risks at national level and a contribution at the national
banking system level to account for interconnectedness. The mutualised fund solution overcomes this
need by raising funds at bank level relative to all other participating banks across the Banking Union,
so factoring in cross-border interconnectedness in one single contribution from each participating
bank. Due to its loss absorbing capacity, a fully mutualised fund (EDIS) would be in a good position
to deal with potential spill over effects among all banks in the Banking Union. A centralised
governance of the mutualised fund would also ensure the uniform implementation of the risk-based
contribution without the need for a two-tier system of national and supranational contribution rules.
Efficiency and cost neutrality. The mutualised fund and the mandatory reinsurance model with a
central body are similar in terms of efficiency and offer a better management of funds than mandatory
lending in the collection and during liquidation or resolution. While all options offer a neutral solution
in terms of the total cost of the intervention, the mutualised fund offers a more balanced redistribution
of losses across banks, which does not penalise banks for their nationality but only for the way they
manage their risk exposures.
Moral hazard. The mandatory lending model offers protection against moral hazard because full
repayment of loans is required, implying no participation in losses by the lending DGS. However, the
different safeguards foreseen for the reinsurance and the mutualised fund model (EDIS) are
comparable in terms of reducing moral hazard incentives. Bank level risk-based contributions in EDIS
reduce incentives for banks to misbehave. With the creation of the Single Supervisory Mechanism
and the Single Resolution Mechanism, the increased centralisation of prudential rule-making and
supervision has already significantly reduced monitoring costs and so moral hazard. These safeguards
come on top of other ‘built-in’ features of EDIS, such as the unified governance of funds or the
disqualification to the access to coverage in case a Member State violates the principle of sincere
cooperation.
The transitional period in the EDIS proposal. This non-paper also discusses the transition from
reinsurance, to coinsurance and to a steady-state fully mutualised fund under the EDIS proposal,
comparing the alternative phases and assessing the effects on the current funding path. The analysis
shows that the loss absorbing capacity of EDIS, compared to a purely national system, strongly
increases along the different phases. The analysis also deals with the evolution of the EDIS funds
suggesting a funding path where contributions to the fund are spread as evenly as possible over time
to avoid potential cliff effects.
5
Specific issues in the design of EDIS
National options and discretions. The DGSD leaves Member States with a degree of discretion in a
number of areas. EDIS would preserve such discretion to the extent it is necessary to accommodate
Member States' specificities. However, wide differences in national implementation due to retained
discretions could impair depositor confidence and the effectiveness of the internal market. The effect
analysis therefore reviews the interaction of the EDIS proposal with national discretions under the
DGSD, identifying those which should be retained and indicating how the retained discretions would
be managed under EDIS.
Irrevocable Payment Commitments (IPC). The use of irrevocable payment commitments (IPC) are
not envisaged in the EDIS proposal. The analysis identifies a number of operational and procedural
risks that support this decision.
Temporary High Balances and other options and discretions. The DGSD envisages that the DGSs
provide coverage also for temporary high balances (THBs) in an account, as a result of special
transactions, such as real estate transactions or insurance claims. The level of protection and time
period is left to the discretion of the Member States. The information provided by Member States,
together with the exceptional nature of these transactions, suggests that their magnitude is likely to be
small compared to the 'regular' deposit claims in case of a pay-out. Therefore, the policy option
adopted in the EDIS proposal to cover THBs appears to be correct.
EDIS scope. As regards non-CRR entities, the effects analysis looks at different options in terms of
scope concerning non-CRR entities and third country branches. On non CRR-entities, the EDIS
proposal would cover all credit institutions affiliated to a participating DGS. On third country
branches, the proposal respects the discretion granted by the DGSD to Member States as regards the
equivalence test of deposit protection for third country branches. Therefore coverage by EDIS
depends on the exercise of such discretion. As regards preventive or alternative measures, these
should not be covered by EDIS since they are only used by a very limited number of Member States
and are therefore not considered to be core functions to be financed by EDIS. Instead, EDIS funding
for preventive and alternative measures would mutualize expenditures for measures that would be
exclusively decided by each Member State with no input from the central body (SRB).
Contributions. The principle that bank contributions to DGS should be risk-based is already
established by the DGSD. This analysis sets out how this principle could be applied in the EDIS
context. Notably, in the reinsurance phase of EDIS, where risks remain largely at the level of the
(national) DGS, a bank’s risk profile relative to the its (national) DGS peer group could determine its
risk-base. When EDIS becomes a system with shared risks at Banking Union level, starting with co-
insurance, an individual bank’s risk-base could be determined relative to all banks in the Banking
Union.

6
1. CONTEXT OF THE EFFECTS ANALYSIS (EA)
On 24 November 2015, the Commission adopted a proposal for a European Deposit Insurance
Scheme (EDIS).
1
The proposal builds on the existing Directive on Deposit Guarantee Schemes
2014/49/EU (DGSD), which harmonizes key elements of the current framework for national deposit
guarantee schemes (DGS). The DGSD benefited from a comprehensive impact assessment by the
European Commission in 2010
2
. That impact assessment already demonstrated that introducing a pan-
European deposit guarantee scheme would have a number of advantages compared to the current
system; the option of a pan-European scheme was not pursued at that time, but now forms the basis of
the EDIS proposal. In addition, the EDIS proposal maintained the current national DGSD target level
(0.8% of covered deposits at national level). Therefore, the Commission considered the EDIS
proposal to be founded on solid grounds.
During negotiations with the Council on the EDIS proposal, the Commission was invited to
supplement the impact assessment for the DGSD with an analysis of the effects of the policy choices
included in the proposal.
3
In addition, the ECON rapporteur in her working document of 16 June 2016
invited the Commission to provide an assessment of the impact of the EDIS proposal. In order to
facilitate progress in the negotiations, the Commission committed to the Council and European
Parliament to prepare such an "effects analysis" by October 2016
4
. The effects analysis, which is
presented in the remaining sections of this non-paper, comprises the following elements:
an outline of the existing framework for national DGS in the European Union;
the effects of the proposed EDIS proposal compared to alternative policy options; and
the interaction between national options and discretions under the DGSD and EDIS.
1
http://eur-lex.europa.eu/legal-content/EN/TXT/PDF/?uri=CELEX:52015PC0586&from=EN
2
http://eur-lex.europa.eu/legal-content/EN/TXT/PDF/?uri=CELEX:52010SC0834&from=EN
3
http://www.europarl.europa.eu/sides/getDoc.do?pubRef=-%2F%2FEP%2F%2FNONSGML%2BCOMPARL%2BPE-
585.423%2B01%2BDOC%2BPDF%2BV0%2F%2FEN
4
Letter of Vice-President Dombrovskis and Commissioner Lord Hill to the ECON Chair, Roberto Guatieri, and to the
Minister of Finance of Slovakia and President of the ECOFIN Council, Peter Kazimir, dated 14 July 2016.

7
2. THE EXISTING FRAMEWORK FOR DGS IN THE EUROPEAN UNION
The current DGSD Directive is the starting point for the EDIS proposal, which integrates some of the
main features of the Directive. Some of those features present operational challenges for
implementing EDIS, but will ultimately produce efficiency gains.
The scope of the DGSD requires all credit institutions to join an officially-recognized DGS at national
level, with the possibility for institutional protection schemes (IPS) to be recognized as DGS.
Depositors at bank branches in another Member State are reimbursed by the DGS in the host Member
State, which acts as a “single point of contact” on behalf of the home DGS.
The level of depositor protection under the DGSD has been harmonized at €100.000 per depositor,
per bank. The repayment deadline must be gradually reduced from 20 working days at present, to 7
working days by 2024 at the latest. During this transitional period, depositors in need may ask for a
so-called social pay-out, i.e. a limited amount to cover their costs of living to be paid within 5
working days.
In terms of depositor information, the DGSD ensures that depositors are aware of the key aspects of
protection of their deposits by DGS. For example, when depositing money in a bank, depositors must
countersign a standardised information sheet containing all relevant information about the coverage of
the deposit by the relevant DGS. Banks are obliged to provide their account holders with basic
information about depositor protection on an annual basis.
Under the DGSD, the target funding level for ex-ante funds of DGS is 0.8% of their covered deposits.
This target level must be reached by 2024. Exceptionally, if the DGS has made cumulative
disbursements in excess of 0.8% of covered deposits, Member States may extend the deadline for a
maximum of 4 years. This target level is a minimum and Member States can set higher levels for their
DGS. On the other hand, the DGSD also allows Member States, after approval by the Commission, to
set a lower target level at a minimum of 0.5% of covered deposits if their banking sector is dominated
by large banks which are unlikely to be liquidated and to trigger the use of DGS funds, also in view of
upcoming MREL/TLAC requirements.
DGS funds should consist, in principle, of cash and low-risk assets. A maximum of 30% of funding
can consist of payment commitments. In case ex-ante funding is insufficient, the DGS must
immediately collect ex-post contributions from the banking sector. As a last resort, the DGS should
have access to alternative funding arrangements such as loans from public or private third parties.
There may also be a voluntary mechanism of mutual borrowing between DGS from different EU
Member States (to date no such voluntary lending scheme has been agreed). Bank contributions to
national DGS must be risk-based, i.e. they must reflect the individual risk profile of the bank
concerned. This means that banks with a higher risk profile must contribute more to a national DGS.
The European Banking Authority (EBA) has adopted Guidelines for the calculation of such risk-based
contributions
5
.
As regards the use of DGS funds, the DGSD provides two mandatory functions for every DGS:
A payout function; and
Participation in resolution.
5
EBA, Guidelines on methods for calculating contributions to deposit guarantee schemes, 22 September 2015.

8
The pay-out function
6
is defined by the DGSD as the primary function, if deposits become
unavailable and it is the relevant counterfactual when determining the limits of other uses of the DGS.
As regards participation of the DGS in resolution,
7
in accordance with Article 109 of the BRRD, the
BRRD provides that a DGS is liable for the amount of losses that covered depositors would have
suffered after applying 'bail-in' or other resolution tools if these liabilities had not been protected from
such losses. The DGS participates in resolution either in an 'open bank' bail-in scenario or by
financing the transfer of deposits to a bridge bank and liquidating the remaining estate.
The DGSD also includes an option for DGS to have two additional functions. Member States may
allow DGS to (a) use their financial means so as to prevent failure of an institution under certain
conditions; and (b) finance a deposit book transfer and eventually other assets and liabilities in order
to preserve the access of depositors to covered deposits, in the context of national insolvency
proceedings. The DGSD also leaves discretion for Member States in other areas, for instance to use
DGS to cover temporary high balances in depositor accounts and to accept irrevocable payment
commitments in funding DGS.
The EDIS proposal builds on and completes these key features of the current DGSD. EDIS's target
level is the same (0.8%), bank contributions are risk-based, both deposit pay-outs and resolution
interventions are covered by EDIS, and certain national discretions are permitted to reflect Member
States specificities. Payment commitments are, however, not included under EDIS, for reasons of
operational efficiency: in a pay-out event funds must be quickly accessible and disbursable in order to
meet applicable deadlines.
6
Article 11(1) DGSD
7
Article 11(2) DGSD

9
3. EFFECTS ANALYSIS OF THE MAIN POLICY OPTIONS
This chapter discusses the policy options on which the EDIS proposal is based, as well as relevant
alternatives. Using an empirical analysis of the effects of the proposal, the effects of the EDIS
proposal are benchmarked against two main alternative models for a pan-EU approach to DGS in the
way options score against key objectives.
3.1. The design of a pan-European deposit insurance scheme
A single deposit insurance scheme is widely considered to be one of the three pillars of the banking
union, together with the Single Supervisory Mechanism (SSM) and the Single Resolution Mechanism
(SRM). The rationale behind the single deposit scheme is to ensure resilience and further weaken the
sovereign-bank nexus. With a purely national DGS, depositor protection can be overwhelmed by
large local shock. As explained in chapter 2, the objective of the DGSD was to upgrade the capacity
of national DGS to withstand local shocks. The following sections assess whether the measures
provided in the DGSD are sufficient and whether a single deposit insurance scheme would enhance
depositor protection via scale and diversification benefits.
Designing a single deposit guarantee scheme for the banking union area involves the pooling of risk
and governance. Risk pooling implies the possibility of national DGS sharing losses at a
supranational level. Governance pooling implies a degree of mandatory coordination between national
DGS at a supranational level in delivering protection to depositors. Figure 1 below shows the list of
theoretically available options combining risk pooling and governance pooling. All the possible
combinations of risk and governance pooling assume a mandatory contribution by national DGSs or
by banks directly. A mechanism of voluntary lending is already in place with the DGSD, but it has
never been used so far. A voluntary mechanism of reinsurance might as well be unable to offer
(voluntary) protection mechanisms for shocks whose downside risk is a bank run.
Figure 1. Risk vs Governance pooling (all options)
Mandatory reinsurance by
independent national DGSs
Mandatory lending by
independent national DGSs
Full mutualisation among
independent national DGSs
Mandatory reinsurance by a
network of national DGSs
Mandatory lending by a
network of national DGSs
Full mutualisation by a
network of national DGSs
Mandatory reinsurance by a
single entity
Mandatory lending by a
single entity
Fully mutualised fund
In theory, there are at least nine combinations of risk pooling and governance pooling.
Risk pooling among national DGS can be envisaged along a spectrum ranging from mandatory
reinsurance and lending arrangements to full mutualisation. A mandatory reinsurance arrangement
among national DGS partially pools risk, but the pooling is contingent on the scale of funding
Risk pooling
Governance
pooling

10
required by the borrowing DGS and the probability of repayment to the lending DGS. A mandatory
lending arrangement also partially pools risk, but requires some minimum level of lending by
participating DGSs, irrespective of the scale of funding required and the probability of repayment. A
fully mutualised arrangement pools risk fully, implying that any losses incurred by a participating
national DGS will be directly covered by the common fund, which will raise funds directly from
banks.
Governance pooling among national DGS can be envisaged along a spectrum ranging from separate
bilateral arrangements, to arrangements centrally co-ordinated within a network, to unified
governance via a single entity. The degree of coordination required among national DGSs gradually
increases along this spectrum. A network of DGSs requires a minimum level of coordination through
a central body that would coordinate and require action in well-defined areas. National DGSs would
still retain control over areas that are not covered by the supranational agreement. Finally, governance
via a single entity would shift decision-making powers to a central institution that ensures the smooth
functioning of the scheme, using national DGSs as contact points. This option minimises coordination
costs in a crisis, when the risk of a bank run is highest. Nevertheless, centralising governance
increases the monitoring costs of all agents (national banks and supervisors), which may require
specific actions (as discussed in section 3.3)
3.2. Policy options for risk and governance pooling
A voluntary lending mechanism among Member States represents the status quo under the DGSD, but
it has never been used so far. Of the nine potential combinations of risk pooling and governance
pooling in Figure 1, three alternative steady-state arrangements are further assessed in this analysis
(see Figure 2):
A mandatory reinsurance via funding by a network of national DGSs (as in phase 1 of EDIS;
Option 1);
Mandatory lending among Member States via a network of DGS, as proposed by the
Commission in the context of DGSD (Option 2).
Full mutualisation among Member States via a single entity, which is the steady-state
arrangement underlying the EDIS proposal (Option 3).
Arrangements based on mandatory reinsurance, mandatory lending or a fully mutualised fund agreed
bilaterally among DGSs are not considered further in this analysis because, without some degree of
governance coordination through a supranational agreement, none of these arrangements would be
feasible in a Banking Union context. For example, the governance of these arrangements when and
under what circumstances the mandatory lending takes place and a coordination and enforcement
mechanism is necessary and would be very difficult if this would be left to national DGSs. Ultimately,
the incentive misalignment created in pooling risk without pooling governance would result in
coordination challenges, which would ultimately undermine depositor confidence in the capacity of
these arrangements to function effectively in a banking crisis.

11
Figure 2. Risk vs governance pooling (policy options)
Mandatory reinsurance by
independent national DGSs
Mandatory lending by
independent national DGSs
Full mutualisation among
independent national DGSs
Mandatory reinsurance by a
network of national DGSs
(Option 1)
Mandatory lending by a
network of national DGSs
(Option 2)
Full mutualisation by a
network of national DGSs
Mandatory reinsurance by a
single entity
Mandatory lending by a
single entity
Fully mutualised fund
(Option 3)
All three models will be compared in the steady state, i.e. as they could exist in the final phase of the
EDIS proposal. Note that the EDIS proposal only envisages a fully mutualised fund as a steady state
objective. However, for the purposes of this effects analysis, other options have also been considered
as steady state outcomes in order to compare and benchmark the outcomes of the available policy
options. The co-insurance model, which is one of the phases of the transitional period, is not included,
as it was originally designed only for the transition phases and its economic effects are in great deal
similar to a mandatory reinsurance model, which is already part of this.
It should be noted that none of the three arrangements envisages a common fiscal backstop, which
would be available if EDIS funding (including ex-post contributions by banks) proved insufficient in
a crisis. In the absence of a common backstop, the ultimate responsibility for deposit insurance
beyond the EDIS funding capacity would lie with the Member State concerned. The pros and cons of
providing a common fiscal backstop in terms of enhancing depositor confidence and reinforcing
financial stability are not examined in this analysis.
Box 1. Liquidity and loss: definitions
A DGS typically plays two interconnected roles in the context of a bank failure. First, the DGS must
immediately pay out for covered deposits. The DGS meets its pay-out commitments with available
funds and ex-post contributions in the few days following the crisis. In this role, the DGS is a liquidity
provider. Second, the DGS participates as a creditor in the subsequent resolution/insolvency
proceedings relating to the failed bank so as to recoup the funding used to cover the pay-out. To the
extent that these funds are not fully recovered, the DGS will be required to absorb a loss. The
following definitions of liquidity and loss are used throughout the following sections.
Liquidity shortfall (LS) is the amount of covered deposits in the failing bank which exceeds the total
available financial means in the DGS (i.e. under the DGSD, available funding plus extraordinary
contributions that the DGS can raise within 3 days from the pay-out event).
Uncovered liquidity shortfall (ULS): the amount of covered deposits in the failing bank that cannot
be covered either by the DGS through its own available financial means or through additional funding
Risk pooling
Governance
pooling

12
made available via a supranational arrangement.
8
Loss retention (LR) is the loss that still needs to be covered after collecting insolvency proceeds and
receiving long-term extraordinary contributions from the banks, but before additional the additional
funding made available by supranational agreements.
Uncovered loss (UL) is the loss that the national DGS or the Member State has to bear after
collecting insolvency proceeds, long-term extraordinary contributions from banks at national level
and after receiving additional funding made available via a supranational arrangement (in the case of
mandatory re-insurance or a fully mutualised fund) or after supranational funds have been (partially)
repaid under a lending arrangement.
Pay-out: the amount of covered deposits that a DGS is required to cover as a consequence of bank
failures.
Available Financial Means (AFM): amount of funds at the disposal of a DGS.
Extraordinary Contributions (EC): extraordinary contributions that can be raised by the DGS in
need within 1 year.
Recovery rate (R): the amount that can be recovered during insolvency proceedings.
Mandatory reinsurance 3.2.1.
The arrangement is a form of risk pooling based on a partial re-insurance of the risk that is evaluated
at a market price or with a market-like estimation (risk-based contribution) of potential funding
provisions to a DGS in need. The model reinsures with its own funds only after a national DGS has
depleted its own resources, which are capped at either 0.6% (option 1) or 0.4% (option 2) of national
covered deposits, plus an additional 0.5% that can be raised from banks through ex post extraordinary
contributions. The pooled funds would be managed by a central body, as it ensures uniform and rapid
procedures and governance in the event of a shock.
9
Compared to other models, the 'reinsurance effect' is defined by restrictions on the use of pooled
funds to absorb:
the liquidity shortfall; and
the loss retention (see Box 1).
The restriction can take the form of an obligation to deploy funds of the national DGS first and/or the
use of additional caps to the use of pooled funds for uncovered liquidity and/or losses (as in the
reinsurance model proposed by the Commission for the transition period). In addition, the
contribution to the reinsurance body is calculated on the basis of risk of the domestic banking system
that contributes via the national DGS.
8
The concept of "uncovered liquidity" does not mean that the national DGS would become free of its obligations to
reimburse depositors according to Art. 8(1) DGSD, instead the DGS would have to obtain alternative funding as
required by Art. 10(9) DGSD.
9
This model could also rely on a system of independent DGS that would allocate their contributions on their own books and
make them available upon request. This alternative option (Option 1A), would not be guaranteed to work successfully
in practice and would be difficult to manage in a crisis situation, when a liquidity provision is required immediately.

13
Table 1. Mandatory reinsurance model - Key characteristics
Governance
Risk-based
contribution
Total Cap
10
Ex post
contribution
Liquidity
shortfall
Excess loss
Supranational
agreement
National
banking
system level
Option 1: 0.2% covered
deposits at EU level and
0.6% at national DGSs
(plus 0.5% ex post)
Option 2: 0.4% covered
deposits at EU level, and
0.4% at national DGSs
(plus 0.5% ex post)
Collected only
by national
DGS
Cover set
between
20% and
80%
Cover set
between 20%
and 80%
In practice, Figure 3shows that the 'reinsurance effect' is spread across the liquidity and the loss
phases. Reinsurance intervention only comes after the national DGS has absorbed liquidity shortfall
and losses, until its own funds have been depleted. Caps on the liquidity shortfall and loss cover are
designed to prevent the depletion of the EU fund.
Figure 3. Reinsurance model - Disbursement Phases
Mandatory lending 3.2.2.
Mandatory lending via a network of DGS is a form of risk pooling that requires a minimum level of
funding provision by participating DGS, irrespective of the shock suffered by the national DGS and
the probability that the loan will be repaid. Funds are disbursed in the form of loan with a given
10
The "total cap" in the table describes the funds available in the reinsurance fund and in the national DGSs. In other words,
it allocates the amount of 0.8% of covered deposits which have to be collected under Art. 10 DGSD to the national and
the European level. Additional caps could be introduced to limited the amount provided by the re-insurance to prevent
first mover advantages and. The EDIS proposal contained in the re-insurance phase the caps that the EDIS intervention
cannot in any case be higher than 10 times the level of covered deposits of the national DGS in need and 20% of the
initial target level of the DIF.

14
maturity. For the purpose of the analysis, it is assumed that the funds pooled via mandatory lending
can go up to 0.5% of total covered deposits.
11
These funds support the resources of national DGSs,
which are 0.8% of covered deposits (as already required by the DGSD).
The governance of the funds remains at national level, with procedures for the collection and use of
disbursed funds to be implemented by national DGSs. The maximum amount to be disbursed by each
national DGS will be quantified on the basis of total covered deposits of the lending DGSs, but raised
from banks on the basis of a risk-based contribution calculated on the risk of local banks.
Table 2. Mandatory lending - Key characteristics
Governance
Risk-based
contribution
Total cap
Ex post
contribution
Liquidity
shortfall
Excess
loss
Supranational
agreement
National
banking
system level
0.8% at national
DGSs and 0.5% of
covered deposits
through loans by
other participating
national DGSs
Collected only
by national
DGS
Cover by other
national DGS of
up to 0.5% of
covered deposits
No
coverage
This mandatory lending arrangement is also designed to produce significant disciplinary effects, as it
issues funds in the legal form of a loan, although funds must be made available by national DGS
without a pre-funding obligation. This arrangement does not cover any uncovered losses of the
national DGS, as any loans to other DGS must be fully repaid. Uncovered losses must be addressed
by the national DGS (e.g. via extraordinary ex-post contributions from banks or alternative funding
arrangements).
Figure 4. Mandatory lending model - Disbursement Phases
11
This was the distribution proposed in the DGSD Commission proposal in 2010 and is also currently in the voluntary
lending regime of Art. 12 DGSD.

15
As a result, the mandatory lending arrangement produces its main effects in the initial pay-out phase,
as additional resources are made available exclusively to cover an uncovered liquidity shortfall. As
the obligation to repay the loans from other DGS takes effect, there is no loss absorption from the
arrangement and the risk sharing benefits disappear over time (see Figure 4).
Fully mutualised fund 3.2.3.
Mutualisation via a single entity is a form of risk pooling, which requires the single entity to assume
risk that is equally distributed among participating banks. This is the arrangement underlying the
steady-state phase of the EDIS proposal. In the EDIS proposal, the total funds collected (DIF) and
made available by the single-entity (the Single Resolution Board, SRB) would be equal to 0.8% of
total covered deposits, pre-funded, and 0.5% through ex post extraordinary contributions. The overall
cap does not change compared to the other alternatives. The harmonised governance of the procedures
for the collection and the use of the funds in liquidation and resolution is the distinguishing aspect of
this arrangement. In particular, the SRB would apply one single risk-based contribution formula
across the banking union area. This redistributes risk across the participating banks based on their
individual risk profile and not on the risk profile of their national banking system. As discussed
below, the risk diversification effect is most effective when risk is effectively distributed across all
banks according to their risk rather than their geographical location and is fully in line with the basic
concepts of a Banking Union.
Table 3. Fully mutualised fund - Key characteristics
Governance
Risk-based
contribution
Total cap
Ex post
contribution
Liquidity
shortfall
Excess loss
EU institution
Bank level
0.8% of covered
deposits pre-
funded, plus 0.5%
ex post
contributions
Yes
Fully covered
with available
liquidity
Fully covered
with available
funds
The fully mutualised fund is designed to provide financial stability through incrementally increasing
the risk absorption, i.e. the immediate availability of funds for an uncovered liquidity shortfall and
uncovered losses. Harmonised risk-based contributions and unified governance of the funds would
also provide disciplinary effects against the moral hazard risk (see section 3.4.4).

16
Figure 5. Fully mutualised Fund model - Disbursement Phases
3.3. The incentive structure: moral hazard and risk reduction
Moral hazard in the context of deposit insurance typically concerns the risk of opportunistic behaviour
among banks and depositors in exploiting the implicit state protection of deposits. Among banks, such
opportunistic behaviour can take the form of riskier activities, so as to boost profits, leaving
governments (taxpayers) at greater risk of having to step in to protect depositors in the event a bank
fails. Moral hazard also affects depositors, who can 'free-ride' on the state guarantee to deposit money
where they receive a higher interest rate, regardless of a bank's riskiness. The risk of such
opportunistic behaviour is associated with deposit insurance protection whether it is a national or a
supranational one.
12
To address this form of moral hazard, governments typically enact prudential
regulation to strengthen bank capital, use banking supervision to monitor risk-taking behaviours and
design resolution mechanisms to provide incentives to banks’ management and shareholders to avoid
excessive risk.
12
For an overview of the literature on moral hazard (of banks and depositors) and deposit insurance schemes, among others,
please see B. Bernet & S. Walter (2009), "Design, structure and implementation of a modern deposit insurance
scheme", SUERF – The European Money and Finance Forum, Vienna. Karas, A., Pyle, W. and Schoors, K. (2013),
Deposit Insurance, Banking Crises, and Market Discipline: Evidence from a Natural Experiment on Deposit Flows and
Rates. Journal of Money, Credit and Banking, 45: 179–200; C. Calomiris & M. Jaremski (2016), "Deposit Insurance:
Theories and Facts", NBER Working Paper, N. 22223, April. There is also a growing stream of academic literature that
associates the deposit insurance schemes with damaging moral hazard behaviours in the long-run (A. Demirgüç-Kunt &
E. J. Kane (2002), "Deposit Insurance around the Globe: Where Does It Work?", The Journal of Economic
Perspectives, Vol. 16, No. 2, pp. 175-195; A. Demirgüç-Kunt & E. Detragiache (2002), "Does deposit insurance
increase banking system stability? An empirical investigation", Journal of Monetary Economics, Vol. 49, pp. 1373-
1406; D., Anginer, A. Demirguc-Kunt, M. Zhu (2014), "How does deposit insurance affect bank risk? Evidence from
the recent crisis", Journal of Banking and Finance, Vol. 48, pp. 312-321). Moreover, in reassessing Diamond &
Dybvig’s (1983) model, some authors pointed out that demandable debt may not be the optimal contract for banks (see,
for this discussion, Calomiris & Jaremski, 2016). Nonetheless, as long as banks rely on demandable debt and depositors
ask for deposit-taking services, a deposit insurance scheme typically provide sufficient risk absorption to avoid bank
runs in a crisis.
17
Supranational arrangements for deposit insurance can create an additional source of moral hazard if
not accompanied by appropriate safeguards. The ‘safety net’ provided by these supranational
arrangements, beyond national DGS cover, could encourage local banks to assume more risk and
encourage local supervisors to be more lenient. In pursuing national policy objectives, Member States
could potentially adopt national legislation that creates incentives for increased risks on the balance
sheets of financial institutions as the potential costs of a bank failure would be borne by all Member
States. The possibility of this source of moral hazard is acknowledged in the EDIS proposal, which
builds on and reinforces safeguards that already exist under the DGSD. These safeguards are:
A uniform coverage level of deposit protection, capped at €100.000 across the European
Union, provides the same incentives for all EU depositors to exercise a minimum level of
control over banks’ behaviours;
Accessibility to the coverage by the DIF can be prevented if a national DGS "fails to comply"
with key provisions of the DGSD or if the relevant administrative authority, or any other
relevant authority of the respective Member State have acted in a way that runs counter to the
principle of sincere cooperation as laid down in Article 4(3) of the Treaty on European Union;
Prudential regulation, which sets capital requirements and other requirements to limit banks’
risk-taking, are drafted and implemented at EU level;
In initial (reinsurance) phase, national DGS funding must be fully exhausted before accessing
pooled funding which is capped; this provides powerful incentives for national authorities to
monitor the risk of domestic banks and so limit the risk of having to use deposit insurance.
Together with prudential rules, supervisory practices are also increasingly converging at
European level, and in particular for the banking union area, the introduction of the Single
Supervisory Mechanism (SSM) has taken over prudential supervision of national supervisors
(directly for significant banks and indirectly for less significant ones);
A resolution mechanism, led by the Single Resolution Board, has been established to provide
a single framework for resolving banks, coordinating the work of national resolution
authorities; such a mechanism ensures that all banks within the Banking Union are subject to
the same resolution system, which will provide similar incentives for banks across Member
States;
The BRRD has introduced a preference for DGS claims in the insolvency proceedings and
also an MREL requirement to protect this senior class of creditors.
EDIS envisages that the SRB should be responsible for use of the DIF, so as to define clear
procedures for national DGSs and domestic banks to access the EDIS funds in every
circumstance;
Last, but not least, the bank contributions to the DIF will be risk-based and defined in detail
by level-2 rules. (Risk-based contributions will be part of a separate effects analysis).
Moreover, it seems highly improbable that a Member State would deliberately decide to damage its
own banking sector so as to avail of access to EDIS.
3.4. Comparing the three policy options
The impact of steady-state risk pooling as proposed in EDIS, compared to the status quo of 'no-
pooling', has already been evaluated in an earlier paper for the AHWG and the empirical analysis is
re-presented in Annex 6.5. In particular, the analysis suggests that the proposed steady-state EDIS

18
consistently outperforms the current system of harmonised coverage levels
13
based on voluntary
lending among national DGSs. The pan-European solution has a higher absorption capacity and is
better equipped to withstand multiple pay-out events.
Instead, the analysis that follows compares the effects of the three main models identified in previous
sections in the steady state.
Assessing risk absorption via SYMBOL 3.4.1.
This section tests the theoretical framework, developed in the previous section, using the
unconsolidated balance sheet data of individual European banks to calculate the probabilities of
default through the so-called 'SYMBOL' model (see Annex 6.3 for more details).
14
For each bank in
each simulation run, SYMBOL determines whether it fails. A bank failure happens when simulated
gross losses exceed the total actual capital. These cases trigger the DGS intervention to reimburse the
amount of covered deposits of the failed banks.
15
These basic blocks of the analysis are repeated
100.000 times and results are then aggregated at the EU level. The same set of underlying simulated
banks’ failures is used to assess the performance of the three insurance schemes.
By simulating a shock on probabilities of default of banks, the model calculates aggregate shortfalls,
i.e. losses not covered by national DGSs and by the different European solutions, and compares them
between the three models to establish which one minimises the shortfall for the national and EU
DGSs. In other words, it estimates the absorption capacity of the three models discussed above, when
the area suffers an asymmetric shock.
The performance of the three systems is assessed against two risk absorption dimensions:
a. the ability to cover deposits in the immediate aftermath of a banking crisis (at the payout);
and
b. the ability to cover losses in the long-run, i.e. after the liquidation proceeds have been
collected.
First, the ability to cover deposits in the immediate aftermath of a banking crisis is measured by the
amount of insured deposits that are not covered, given that the funds immediately available are
insufficient. The available funds comprise the national DGS pre-funded amount, together with the
liquidity made available: i) by the reinsurance scheme or the central body, or ii) by other DGSs in the
form of mandatory loans.
Second, the losses that are ultimately borne by the national DGS and the central body in the medium-
long term are computed as the difference between the initial pay-out and the funds only available at a
later stage, including: i) extraordinary ex-post contributions from banks; ii) amounts recovered from
banks’ insolvency procedures, and iii) in the case of the re-insurance scheme, the share of uncovered
losses taken up by a central body. In this analysis, extraordinary ex-post contributions (EC) are equal
13
The 2010 impact assessment (p. 32-33, plus annexes 4-6) concludes that the level of coverage should be harmonised and
suggests a specific level for that. http://ec.europa.eu/internal_market/bank/docs/guarantee/20100712_ia_en.pdf
14
Note that Cariboni et al. (2015a) run simulations country by country independently. Instead, we first simulate losses
jointly for all EU 28 banks, then distribute them across countries. This simulation approach is the same applied in
Cariboni et al (2015b). Please, see Cariboni J., Di Girolamo F., Maccaferri S., Petracco Giudici M. (2015a): Assessing
the potential reduction of DGS funds according to Article 10(6) of Directive 2014/49/EU: a simulation approach based
on the Commission SYMBOL model, JRC Technical report JRC95181 (forthcoming); and Cariboni J., Petracco Giudici
M., Maccaferri S., Hallak I., Pfeiffer P. (2015b): Sustainability Assessment of the European Deposit Insurance Scheme,
JRC Science for Policy Report, JRC98207
15
It would be possible to run the analysis by assuming that the larger banks would be resolved while only the smaller banks
would go into insolvency.

19
to 0.5% of the amount of covered deposits of the relevant Member State. In addition, in this model EC
cannot be raised in the short term (few days after the crisis) to repay depositors, but are available in
the long term to cover the DGS losses.
As regards the computation of the amounts recovered from banks’ insolvency procedures, the
recovery rate has been alternatively set equal to i) 90% of the amount of covered deposits of the
failing banks (a 30 percentage points increase over the average recovery rate in the EU), and ii)
country-specific recovery rates, increased by 30%.
16
The increase over the regular rate of recovery is
added to reflect that DGS claims will receive priority in a resolution/insolvency procedure under the
BRRD.
3.4.1.1. Mandatory reinsurance
In a mandatory reinsurance system, national DGSs operate alongside an ex-ante funded central body
(CB). National DGSs are required to reimburse pay-outs and only if there are still uncovered deposits
and national funds are fully depleted, the CB intervenes. Five key assumptions underpin the model.
1. Member States have achieved on aggregate the target (0.8% of covered deposits), which is
partly allocated to the CB and partly to national DGSs. Beta is the share of funds that remains
available to the national DGS. The analysis assesses three scenarios: i) beta = 75%, (i.e. 0.2%
of covered deposits sit with the CB while 0.6% of covered deposits are available in national
DGSs). ii) beta = 50% (0.4% of covered deposits sit with the CB with an equal amount being
available at national DGSs) and iii) beta = 25% (0.6% of covered deposits sit with the CB
with 0.2% of covered deposits being available at national DGSs).
2. When necessary, the central body intervenes to provide reinsurance liquidity to cover a share
(alpha) of liquidity shortfalls. This is a first cap. Alpha may vary over a wide range of values,
up to 100%.
3. The total amount that the CB can contribute to is also capped, according to the following
formula:
This cap is equal to the smallest of following:
On the one hand, it considers the funds available at the national DGS (equal to a share
beta of the total target, see above), and multiplied it by a factor z>1.
On the other hand, it considers the share of the target available at the aggregate EU-level,
multiplied by a factor y<1.
This cap applies to both the liquidity provided in the short term and the amount of losses
borne by the CB in the long term.
4. The DGS can call on banks to supply extraordinary contributions (0.5% of covered deposits)
to cover its losses.
In order to compare options, the mandatory reinsurance model is assessed with different caps.
Table 4. Parameters used for the analysis of mandatory reinsurance
16
Country-specific recovery rates used in this analysis are available in the World Bank's Doing Business 2016 Report.

20
z
y
75%
20%
10
20%
75%
20%
10
80%
75%
80%
10
20%
75%
80%
10
80%
75%
60%
10
60%
75%
100%
10
100%
50%
20%
10
20%
50%
20%
10
80%
50%
80%
10
20%
50%
80%
10
80%
50%
60%
10
60%
50%
100%
10
100%
25%
20%
10
20%
25%
20%
10
80%
25%
80%
10
20%
25%
80%
10
80%
25%
60%
10
60%
25%
100%
10
100%
Note: is the share of funds that remains available to the national DGS; is the share of liquidity
shortfall that can be covered by the central body; z and y are two parameters in the formula defining
the maximum amount (cap) of the central body's funds that can be used by a single DGS: z is a
multiple of a single DGS resources, y is a share of the resources of the central body.
3.4.1.2. Mandatory lending
Under the mandatory lending approach, whenever a national DGS experiences a liquidity shortfall,
the other DGSs are mandated to lend money to the DGS whose available financial means have been
depleted. The lending regime is subject to specific conditions:
1. The AFM of each DGS reach the full target, as defined in the DGSD (i.e. 0.8% of the total
amount of covered deposits in the relevant MS);
2. The total amount that can be borrowed is capped to 0.5% of the covered deposits of the
borrowing DGS;
3. The loan is apportioned among creditor DGSs in proportion to their size;
4. Loans are assumed to be recovered at 100% and for this purpose the borrowing DGS raises
the maximum amount of ex-post contributions (0.5% of covered deposits); if the loan
received is lower than the ex post contributions residual resources are used to cover the losses
of the DGS.
3.4.1.3. Fully mutualised fund
Under this scenario, a single deposit insurance fund at EU-28 level is established. The available
financial means are equal to 0.8% of covered deposits in the EU. As there is no external actor
providing extra resources, there is no distinction between liquidity shortfall and liquidity retention.
The fully mutualised fund can call extraordinary contributions from participating banks (0.5% of
covered deposits) to cover its losses.
3.4.1.4. Simulation of pay-outs
The effect analysis has been developed at the individual bank level and results are then aggregated at
the EU-level. Bank failures implying a DGS intervention are simulated by the SYMBOL model (see
Annex 6.3 for a description). The crisis scenarios have also been generated by the SYMBOL model,
which is based on individual bank balance sheet data. In each simulation, each bank either fails or

21
survives, depending on its initial level of capital and the severity of the crisis. The national DGS is
called upon to cover the insured deposits of failed banks. These central premises of the effect analysis
are repeated 100.000 times.
The three risk pooling arrangements have been assessed in relation to the level of implied uncovered
liquidity shortfall and loss. In particular:
a) Uncovered liquidity shortfall measures the inability of a given scheme to cover deposits in the
immediate aftermath of a banking crisis. This concept corresponds to the amount of insured
deposits that are in fact not covered in the event of a banking crisis, given that funds are
insufficient. The available funds comprise the national DGS pre-funded amount, together with
the liquidity made available: i) by the central body in the reinsurance scheme, or ii) by other
DGSs in the form of mandatory loans.
b) Losses in the medium-long term, which are ultimately borne by the national DGS and by the
central body (in the case of re-insurance), are computed as the difference between the initial
payout and the funds only available at a later stage, i.e. i) banks’ extraordinary contributions
to the DGS and ii) amounts recovered from banks’ insolvency procedures.
The data used for the present exercise is as of 2013
17
. The dataset covers a sample of around 3,400
banks from the EU-28, representing 99.86% of EU28 banks’ total assets (see Table 5).
18
The analysis
focuses on total assets, risk-weighted assets and total capital and/or capital ratios, as well as customer
deposits.
Table 5. Sample banks dataset (data from 2013)
Number of
banks
Total assets
bn€
RWA bn€
Covered
deposits bn€
Capital bn€
3,359
38,144
14,635
6,474
1,939
3.4.1.5. Key Results
This section compares the three options as follows:
a) Fully mutualised fund against mandatory lending
b) Fully mutualised fund against mandatory reinsurance
c) Mandatory reinsurance against mandatory lending
In each case, both the short term (uncovered liquidity shortfall) and the medium-long term
performance (uncovered loss) are evaluated. The reported charts and figures refer to rather extreme
crisis scenarios, involving simulations where at least one of the two compared schemes yields
uncovered liquidity shortfall or loss. In less extreme scenarios (some 90% of the simulations), the
alternative schemes are obviously equivalent.
All charts presented in this section focus on the worst 1% of simulations (i.e. percentiles from 99
th
to
100
th
on the x-axis), corresponding to banking crises of increasing severity. In all charts, the severity
of the crisis increases moving from the left to the right.
17
Data provided by Bankscope, a proprietary database of banks’ financial statements produced by Bureau van Dijk.
18
We use the amount of total assets in the banking sector excluding branches as provided by ECB as reference for the
population.

22
The fully mutualised fund against mandatory lending
Figure 6 shows the distribution of uncovered liquidity associated with each SYMBOL simulation.
Points on the far right of the curve represent more severe crisis scenarios, and are indeed associated
with larger amounts of uncovered liquidity shortfall. The curve representing uncovered liquidity
shortfall under mandatory lending (dotted) is always above the curve representing uncovered liquidity
shortfall under the mutualised fund (solid). The conclusion is that in none of the simulations
mandatory lending is able to deliver a smaller amount of uncovered liquidity shortfall than a
fully mutualised fund. This is because loans are capped at 0.5% of the covered deposits of the
borrowing DGS under mandatory lending, while under fully mutualised fund a larger amount of
liquidity is available.
Figure 7 shows the distribution of medium-long term losses associated with each SYMBOL
simulation. Again, points on the far right of the curve represent more severe crisis scenarios, and are
indeed associated with larger losses. The conclusion is that full mutualisation again turns out to be
superior to mandatory lending in terms of uncovered losses for national DGS. Indeed, the curve
representing uncovered losses under mandatory lending (dotted) is always above the curve
representing uncovered losses under full mutualisation (solid). In other words, uncovered losses under
full mutualisation are always smaller than under mandatory lending. This is due to the fact that under
mandatory lending, extraordinary contributions raised by the DGS and amounts recovered from
insolvency procedures are devoted to repay the loans instead of being used to cover the DGS losses.
Figure 6. Aggregate uncovered liquidity shortfall under mandatory lending (dotted line) and
fully mutualised fund (solid line), EU28.

23
Figure 7: Aggregate uncovered losses under mandatory lending (dotted line) and under fully
mutualised fund (solid line), EU28
The fully mutualised fund against mandatory reinsurance
The fully mutualised fund offers greater absorption capacity than mandatory re-insurance for
short term uncovered liquidity needs in all the simulations. This is because more funds are
available to the national DGS under a fully mutualised fund than under mandatory re-insurance,
where various caps are foreseen. For instance, with an example of parameters' combination,
19
Figure 8
shows how the curve associated with the fully mutualised fund (solid) is always below the curve
associated with the mandatory re-insurance scheme (dotted). Results shown in Figure 8 hold for other
combinations of parameters (see Annex 6.4). It should be noted, however, that when a central body is
allowed to cover liquidity shortfalls and losses in full (i.e. alpha and y=100%), the performance of the
mandatory reinsurance scheme is only slightly inferior to that of a fully mutualised system.
A fully mutualised fund offers greater absorption capacity than mandatory re-insurance also
for medium-long term uncovered losses. As the amount of losses borne by the central body is
capped under mandatory reinsurance, the central body can bear losses until its funds are depleted
under the fully mutualised fund. As suggested in Figure 9, the amount of uncovered losses is larger
under reinsurance than under full mutualisation in every SYMBOL simulation.
19
beta equals 75%, and alpha and y are both set at 60%

24
Figure 8. Aggregate uncovered liquidity under mandatory reinsurance (dotted line) and under
fully mutualised fund (solid line), EU28
Figure 9. Aggregate uncovered losses under mandatory reinsurance (dotted line) and under
fully mutualised fund (solid line), EU28
Mandatory reinsurance against mandatory lending
As regards comparing mandatory reinsurance and mandatory lending, additional statistics are
provided. Table 6 shows how the two models perform for in terms of uncovered liquidity shortfall and
25
uncovered losses. The table reports the share of simulations in which the better arrangement yields
lower uncovered liquidity and uncovered losses.
The relative performance of the two schemes with respect to uncovered liquidity shortfall and
uncovered losses crucially depends on the parameters underlying the mandatory reinsurance scheme.
As expected, parameters with lower caps of available reinsurance funds are associated with a worse
performance of the mandatory reinsurance scheme compared to mandatory lending in the short
(uncovered liquidity shortfall) and in the long run (uncovered losses). However, when mandatory
reinsurance caps are high, the mandatory reinsurance delivers a better coverage than mandatory
lending of short term liquidity and long-term loss cover needs.
As regards the combination of the two caps, raising the share of liquidity shortfall that can be re-
insured (alpha) from 20% to 80%, while keeping y (cap on the coverage) at 20%, improves the
performance of the reinsurance arrangement so that mandatory reinsurance becomes broadly
comparable to mandatory lending. When y is set at 80%, raising alpha from 20% to 80% makes re-
insurance the preferred arrangement over mandatory lending. The above results are valid both under a
balanced split of funds between the central body and the national DGS (beta=50%) and under an
unbalanced split (beta=75% or 25%). Analogously to what happens when varying alpha, the
performance of re-insurance improves under larger y. However, even with y=80%, alpha needs to be
set at a larger value for reinsurance to outperform mandatory lending. In general, if either alpha or y
are set too low, no matter how large the other parameter is, mandatory lending will turn out to be
preferable under current arrangements.
Moreover, while mandatory reinsurance prevails for higher caps in most of the runs, there are also
two cases in which the mandatory reinsurance arrangement is strictly superior to the mandatory
lending arrangement, i.e. the latter is outperformed in 100% of the simulations. This occurs if the
central body is allocated half (beta=50%) or ¾ (beta=25%) of the funds, with caps on uncovered
liquidity shortfall (alpha) and uncovered loss (y) at 100% (i.e., full cover).
For long-term uncovered losses, the re-insurance arrangement turns out to be generally preferable for
higher caps of loss cover (for alpha at least equal to 60% or to 80% in case national DGSs are
allocated ¼ of the resources), when the recovery rate is set at 90% for all the countries (see Table 7).
This is in line with the fact that increasing the amount of resources available at European level makes
the reinsurance arrangement absorb more losses. However, if the simulation uses recovery rates of
individual Member States (with an increase of 30% to take into account the new BRRD priority for
DGS claims), the mandatory reinsurance arrangement performs better even with higher caps of loss
coverage only (see Table 6). This might be due to the fact that banks with more distressed balance
sheets tend to be in countries where the legal framework is more uncertain.

26
Table 6. Mandatory reinsurance vs mandatory lending with individual MSs' recovery rate
(increased by 30% to factor in the BRRD priority for DGSs' claims)
Table 7. Mandatory reinsurance vs mandatory lending with recovery rate = 90%
It should be noted that if losses are very small, the share borne by the central body under re-insurance
may turn out to be lower than the funds initially contributed by the national DGS to the central fund.
In line with any insurance mechanism, the insurance premium may turn out to be larger than the
payout, if the event triggering coverage is associated with a small enough loss. This is consistent with
the fact a European reinsurance mechanism should be most effective for systemic events and should
Preferred
scheme
Share of simulations in
which the preferred
scheme outperforms the
competitor
Preferred
scheme
Share of simulations in
which the preferred
scheme outperforms the
competitor
alpha = 20%, y = 20%
ML 68% R 73%
alpha = 20%, y = 80%
ML 57% R 73%
alpha = 80%, y = 20%
R 52% R 97%
alpha = 80%, y = 80%
R 73% R 97%
alpha = 60%, y = 60%
R 59% R 93%
alpha = 100%, y = 100% R 98% R 100%
alpha = 20%, y = 20%
ML 74% R 52%
alpha = 20%, y = 80%
ML 66% R 52%
alpha = 80%, y = 20%
R 50% R 85%
alpha = 80%, y = 80%
R 66% R 85%
alpha = 60%, y = 60%
R 57% R 81%
alpha = 100%, y = 100% R 100% R 100%
alpha = 20%, y = 20%
ML 82% ML 65%
alpha = 20%, y = 80%
ML 77% ML 65%
alpha = 80%, y = 20%
ML 62% R 74%
alpha = 80%, y = 80%
ML 51% R 74%
alpha = 60%, y = 60%
ML 59% R 66%
alpha = 100%, y = 100% R 100% R 100%
beta = 75%
(0.6% to DGS -
0.2% to CB)
beta = 50%
(0.4% to DGS -
0.4% to CB)
beta = 25%
(0.2% to DGS -
0.6% to CB)
Re-insurance parametrization
Liquidity
Loss
Preferred
scheme
Share of simulations in
which the preferred
scheme outperforms the
competitor
Preferred
scheme
Share of simulations in
which the preferred
scheme outperforms the
competitor
alpha = 20%, y = 20%
ML 68% ML 55%
alpha = 20%, y = 80%
ML 57% ML 55%
alpha = 80%, y = 20%
R 52% R 88%
alpha = 80%, y = 80%
R 73% R 88%
alpha = 60%, y = 60%
R 59% R 84%
alpha = 100%, y = 100% R 98% R 100%
alpha = 20%, y = 20%
ML 74% ML 84%
alpha = 20%, y = 80%
ML 66% ML 84%
alpha = 80%, y = 20%
R 50% R 73%
alpha = 80%, y = 80%
R 66% R 73%
alpha = 60%, y = 60%
R 57% R 67%
alpha = 100%, y = 100% R 100% R 100%
alpha = 20%, y = 20%
ML 82% ML 97%
alpha = 20%, y = 80%
ML 77% ML 97%
alpha = 80%, y = 20%
ML 62% R 55%
alpha = 80%, y = 80%
ML 51% R 56%
alpha = 60%, y = 60%
ML 59% ML 53%
alpha = 100%, y = 100% R 100% R 100%
beta = 25%
(0.2% to DGS -
0.6% to CB)
beta = 75%
(0.6% to DGS -
0.2% to CB)
beta = 50%
(0.4% to DGS -
0.4% to CB)
Re-insurance parametrization
Liquidity
Loss

27
provide incentives for local banks and regulators not to use it for small interventions, whose necessity
for the stability of the financial system can be hardly assessed by the central body.
Finding #1. The fully mutualised fund offers greater protection than both the mandatory reinsurance
and the mandatory lending arrangements in all simulations, both in the short term (uncovered
liquidity) and in the medium/long term (uncovered losses). In the short term, the fully mutualised fund
makes more funds available, compared to the alternatives.
Finding #2. In the medium-long term, the probability of uncovered losses, implying failure of the
DGS itself, is the smallest under the fully mutualised fund, as extraordinary contributions are not
used to repay loans, as in the case of mandatory lending, but to cover losses. Under re-insurance, the
participation of the central body to the losses is capped.
Finding #3. As for the comparison between mandatory lending and mandatory reinsurance,
mandatory reinsurance is better able to cover liquidity needs in the short term or losses in the
medium-long term provided that sufficient re-insurance funds are made available.
Finding #4. The performance of mandatory reinsurance depends on the interplay between allocation
to the central body and the caps applied to resources made available by the central body to the
individual DGSs. Larger allocations from the central body obviously imply larger shares of liquidity
and losses which can be centrally covered.
Assessing diversification of risks under the three alternative arrangements 3.4.2.
The first part of the following assessment measures the implications for risk diversification in
moving from a solution with partial risk sharing (such as reinsurance or mandatory lending) to an
environment with full risk sharing (such as full mutualisation). Indeed, as risk sharing grows, there is
an increasing risk diversification across the participating Member States. The following formula
(developed in Annex 6.1) demonstrates that a mutualised DGS can make full use of risk
diversification to minimise the expected losses for bank i in country j (
It should be noted that the reinsurance and mandatory lending arrangements assume the collection of
contributions from national DGSs, based on the risk profile of banks within their local banking
systems. Within a mutualised arrangement the contributions of banks are calculated on the basis of
their risk profile within the Banking Union. This brings greater diversification of risk because the
value of the weighting factor in the reinsurance and mandatory lending models (
is structurally
higher than the weighting factor for the single DGS (
.
<
As a result, the expected loss under the single DGS scenario is lower than a scenario involving
multiple DGSs (unless the improbable scenario applies in which only one bank participates in each
DGS or the probabilities of default across banks are perfectly correlated). The example, developed
further in the annex, indicates that the benefits of risk diversification are significant and could halve
expected losses at aggregate level.
Finding #5. A fully mutualised fund offers greater risk diversification (portfolio effects), which
minimises the expected losses for the whole financial system in case of an asymmetric shock.

28
Finding #6. Moving from a risk-based contribution calculated on the average risk of the national
banking system to a contribution based on the risk of individual banks also offers strong protection
against moral hazard and makes risk diversification most effective.
Assessing the implications of interconnection among EU banks 3.4.3.
The analysis so far has compared the effects of a mutualised system to a system of national DGS. The
losses for each national DGS were simulated on a stand-alone basis for each DGS, i.e. each DGS’ risk
was regarded as idiosyncratic without consideration of a possible interconnection among probability
of default of European banks. The purpose of this section is to assess the degree of interconnectedness
among banks, and hence DGS, i.e. whether the failure of a bank in one Member State can cause a
spike in the probability of failure of any given bank in another Member State which could impact the
use of funds even for 'safer' national DGSs.
To estimate the cross-border interconnection of probabilities of default, the following model estimates
the correlation between the Credit Default Swap (CDS) premia (a proxy of probability of default) for
a sample of banks in the European Union. This sample collects daily CDS premia (mid-price) on 5
years senior debt of the top 30 EU banking groups and top 2 banks per country for which CDS
contracts are actively traded. The table in the annex lists the banks and countries covered by this
exercise, as a result of the application of the described criteria. The sample includes 35 banks from 12
European countries.
The analysis is divided into two stages. In the first stage, we regress in panel data context the CDS
premium of bank i at time t on the average CDS spread of all banks except bank i:
Where CDSpremium
i,t
: the CDS spread of bank i at time t; a
i
: unobserved time-invariant country
effect; BankAverage
j,t
: the average CDS spread of all banks except bank i.
The results show a strong correlation between the CDS premia of a bank with the average spread for
all the other banks in the sample (see Output #1 in Annex). An average increase of 100 basis point in
the CDS premium of the other banks in the sample is accompanied by approximately 80 basis points
increase in the CDS spread of a given bank.
In the second stage, we add the average CDS spread of all banks in same country except the bank of
interest to control for the country-level credit risk:
Where NonDomesticBank
j,t
is the average CDS premia of all banks outside the country where bank i is
and
is the average CDS premia of all banks in the same country as bank i except
bank i. Fixed effects are applied in the estimation, allowing for robust errors, to permit each bank to
have a different "base" probability of default due to the idiosyncratic characteristics of the local
economy.
The second regression breaks down the correlation, distinguishing the correlation of a given bank
with domestic and non-domestic banks. The correlation with non-domestic banks is only 30% less
powerful than the correlation with domestic banks (see Output #2 in the Annex).
Overall, the analysis shows that the Banking Union area (and generally the EU) is a system of
interconnected banking systems. Concretely, cross-border interconnection appears to have a sizable
impact on the CDS premium of each bank. This reflects the likelihood that bank defaults in one

29
country will have an impact on banks in another country. In other words, even under a system of
purely national DGS, risks cannot be isolated nationally.
However, risk-based contributions by individual banks to a national fund do not take into account
implicit costs arising from the interconnection between banks in the European Union. Such implicit
costs could be taken into account in the mandatory reinsurance and mandatory lending models with an
additional contribution based on the size of the banking system. Such size-based criteria would
however be contrary to the principle that contributions should be risk-based established by the DGSD.
On the contrary, a Banking Union wide scheme would, as demonstrated, offer better protection and
thereby reduce the risk of spillovers. Moreover, risk-based contributions would be raised at bank level
and directed towards one common fund, indirectly taking into account the interconnectedness among
probabilities of default of participating banks.
Finding #7. There is a strong interconnection between probabilities of default of European banks. In
a system of single DGS, this implicit cost would need to be made explicit by obliging banks to pay for
it within a two-tier system of risk-based contributions: a bank level one to account for idiosyncratic
risks and a national banking system level one to account for interconnectedness. The fully mutualised
fund solution overcomes this need by raising funds directly at bank level, so factoring this correlation.
Finding #8. The intensity of the interconnection also suggests that a fully mutualised system would
reduce the risk of spillovers, thereby making a second tier system of risk-based contributions
superfluous.
Benchmarking policy options 3.4.4.
Taking stock of the theoretical and empirical analyses, this section benchmarks the three models
against the following objectives:
Risk absorption capacity;
Moral hazard protection;
Funding and governance efficiency; and
Cost neutrality.
For financial stability reasons, the ability of a deposit guarantee scheme to absorb systemic shocks is
the most important objective, as it ensures an immediate response to depositors' worries about the
solvency of one or multiple banks. The failure to provide an immediate response can trigger a bank
run (a self-fulfilling prophecy) and a deeper systemic shock for the financial system. The ability to
absorb risk exemplifies the ability to provide a cover of uncovered liquidity shortfall and uncovered
losses that is big enough to preserve depositors' confidence and deter them from a bank run.
As discussed in section 3.3, all three models also deal with moral hazard in the form of a sovereign-
bank nexus, i.e. when a Member State misuses the funds of the national DGS to protect local banks.
20
The operational efficiency objective considers two dimensions: funding and governance. Funding
efficiency concerns the ability to rapidly collect funds across banks or national DGSs and make use of
them in liquidation or resolution. The governance efficiency accounts for the ability of each
arrangement to manage coordination and administration costs.
20
It is well understood that none of the options eliminates in full the sovereign-bank nexus, as the ultimate fiscal backstop
stays with the local governments. Nonetheless, the different options provide different levels of contribution to limit the
negative effects of this nexus.

30
Finally, the principle of cost neutrality would respond to the need for proportionality of the
mutualised arrangement. This means that a mutualised arrangement should not increase the overall
costs for banks and the overall level of contribution for the banks remains the same (at 0.8% of total
covered deposits), even though the distribution of the contributions among banks may change due to
differences in their risk profile.
3.4.4.1. Risk absorption
Mandatory lending has a very limited risk absorption capacity, due to limited liquidity coverage and
the absence of loss cover. The probability to outperform the other two models in terms of risk
absorption is low. Mandatory reinsurance offers some level of risk absorption through partial
coverage of liquidity shortfall and losses. The reinsurance model with a central body, however, offers
a higher reaction speed, which can result in higher absorption capacity in the wake of a banking crisis
compared to a mandatory reinsurance or mandatory lending with independent national DGSs.
Finally, while protection against moral hazard is comparable to the mandatory reinsurance model (due
to the bank risk-based contribution feature of EDIS), the risk absorption capacity of EDIS is greater
than the other models assessed, due to the immediate availability of funds for both uncovered liquidity
and losses, as well as for the quick response in the management of crises and the direct accessibility to
ex post contributions by banks.
Finding #9. A fully mutualised fund model (EDIS) offers several tools for a more effective risk
absorption and diversification. Reinsurance scores better than mandatory lending, in particular when
there are no (or low) caps for the European intervention in liquidity and loss cover, but it is not as
effective as a fully mutualised fund model (EDIS).
3.4.4.2. Moral hazard
Mandatory lending offers protection against moral hazard by making funds available in the form of
loans and because there is no coverage of uncovered losses. The reinsurance model offers protection
against moral hazard by imposing the first share of uncovered liquidity and losses on the national
DGS. The fully mutualised fund model (EDIS) also offers protection against moral hazard through
calculation of risk-based contribution at bank level, as well as using a central body to decide on the
use of the funds in each crisis/liquidation/resolution situation (in addition to the risk reduction
measures discussed in section 3.3).
Finding #10. The built-in safeguards foreseen for the mandatory reinsurance and the mutualised fund
model (EDIS) ensure that both options offer effective protection against moral hazard.
3.4.4.3. Efficiency (funding and governance)
Mandatory lending offers limited efficiency in the ability to collect and use funds, as it would require
national DGS to collect the funds and make them available if triggered (with no separate entity
managing these funds). Because assistance would be requested on an ad-hoc basis: in the event of
insufficient funds in a DGS creditor DGSs may be hesitate to lend to a requesting DGS even if
lending is formally required by law. The reinsurance model with a central body ensuring coordination,
and EDIS instead offer a more effective management of funds, both in collection (with pre-funding at
EU level) and use (including alternative uses in resolution).
Concerning governance, mandatory lending offers limited or no governance efficiency as decision-
making will be at national level. Mandatory reinsurance and a fully mutualised arrangement with a

31
central body offer a more certain and streamlined decision-making procedure for the collection and
use of funds in liquidation and resolution.
Finding #11. On funding and governance efficiency, a fully mutualised fund model (EDIS) and the
reinsurance model with a central body have similar characteristics and perform better than
mandatory lending.
3.4.4.4. Cost neutrality
The principle of cost neutrality applies uniformly across all the three options. None of the options
increases or reduces the total amount of resources available in case of bank failure. However, the
different temporal phases of European intervention and the distribution of the intervention between
national DGSs and the central body redistribute the burden of each model in different ways. For
mandatory lending, the domestic banking system will bear the greater part of the burden, irrespective
of how risk is distributed across banks. For mandatory reinsurance, the domestic banking system will
take on a more moderate amount of costs, as European intervention is capped after the intervention of
the local DGS. Full mutualisation, instead, offers a redistribution of losses from the beginning that is
equal among banks, based only on their idiosyncratic risk. This solution offers some level of
discipline at national level, as local banks that manage risk better will be treated in the same way as
similar banks across Europe: their nationality becomes irrelevant.
Finding #12. While all the options offer a neutral solution in terms of the total cost of intervention, a
fully mutualised fund model (EDIS) offers a more balanced redistribution of losses across banks,
which does not penalise banks for their nationality but only for the way they manage their risk
exposures.

32
Table 8. Summary of performance vis-à-vis objectives and constraints
Efficiency
Risk absorption
Moral hazard
Funding
Governance
Cost neutrality
Mandatory
Reinsurance
(Option 1)
- Quick response (central
body)
- Liquidity and loss cover
- Depletion of national
DGSs first
- One funding collection point
at EU level
- Pre-funding at EU level
- Use of funds in
liquidation/resolution
procedures
- Common decision-
making procedures
(incl. alternative uses
for resolution)
- Total cost neutral
- Moderate burden on
domestic banks
Mandatory
Lending
(Option 2)
- Immediate liquidity cover
- Funding structured as a
'loan'
- No loss cover
None
- Not efficient
- Total cost neutral
- Heavy burden on
domestic banks
Fully
mutualised
fund (EDIS)
(Option 3)
- Immediate liquidity & loss
cover (equal to the total
cap)
- Quick response (central
body)
- Ex post contribution
- Bank level risk
assessment
(contribution)
- Central decision on the
use of funds
- One funding collection point
at EU level
- Pre-funding at EU level
- Use of funds in
liquidation/resolution
procedures
- Common decision-
making procedures
(incl. alternative uses
for resolution)
- Total cost neutral
- Equal distribution of
burden on EDIS
banks

33
4. THE TRANSITIONAL PERIOD: THE RATIONALE BEHIND THE 'THREE-STAGE APPROACH'
This section gives a short analysis of the three stage approach (re-insurance, co-insurance and full
insurance) as proposed in the Commission proposal.
The transition under the Commission proposal 4.1.1.
As set out in the Commission proposal, EDIS would develop over time and in three phases: starting
with the reinsurance phase in 2017, it would evolve into co-insurance from 2020 onwards to finally
evolve into a fully mutualised insurance system by 2024. There are two main rationales for a multi-
phased approach.
First, given the current differences between Member State DGSs, in particular with regard to their
financial means and the capacity of the European Deposit Insurance Fund (DIF), the approach allows a
smooth transition towards the steady state. By 2024 the DIF would be gradually built-up over all
phases financed by the annual contributions of the banking sector.
Second, the approach aims at avoiding moral hazard and first-mover advantages. For this purpose a
number of safeguards have been attached to each phase. For instance, in the reinsurance phase, where
these safeguards are very strong, a national DGS is required to bear a first share of the loss. These
measures help to protect the financial capacity of the DIF further, in particular in its start-up phase.
Table 9. Main design features of the three stages
Reinsurance phase
(2017 – 2020)
Co-insurance phase
(2020 – 2024)
Full insurance
Steady state 2024
Degree of
mutualisation
First share of loss to be
borne by DGSs ("loss
retention")
Immediate funding
support by EDIS up to
20% of the liquidity
shortfall (Art. 41a (2)
Loss cover up to 20% of
the excess loss (Art. 41a
(3))
Funding/loss cover
capped by the lower of i)
20% of EDIF´s initial
target level or of ii) 10
times the DGS´s target
level (Art. 41a (4))
EDIS support from the
“first euro” following the
risk-sharing mechanism
under Art 41e. EDIS to take
over gradually increasing
shares of funding and loss
cover
(20%/40%/60%/80%)
No loss retention, no
further caps
EDIS to take over 100%
of funding and loss cover
(full mutualisation)
Evolution of
EDIF
To reach 20% of 4/9 of
the sum of DGSs´
minimum target levels
by 2020 (Art. 74b (1))
Ex-ante contributions
only
To reach 100% of the sum
of DGSs´ final minimum
target levels by 2024 (Art.
74b (2)).
Ex-ante and ex-post
contributions
100% of final target level
reached (= 0.8% of
covered deposits)
Ex-ante and ex-post
contributions
Calculation of
risk-based
contributions
Calculation in relation to
the single DGS member
banks only
Calculation in relation to all
banks within the EDIS
scope
Calculation in relation to
all banks within the
EDIS scope

34
Analysis of uncovered liquidity and uncovered losses in the transition period via 4.1.2.
SYMBOL
The assessment of the reinsurance and coinsurance phases in EDIS is based on the SYMBOL model
and follows the same approach described in Section 3.4.1.
21
The model uses the following working
hypotheses:
Extraordinary contributions are set equal to 0 in the short term, but they are assumed to be
available in the long term to cover the DGS losses and fixed at 0.5% of the amount of covered
deposits of the relevant MS;
The recovery rate from insolvency procedures is set equal to 60% of the amount of covered
deposits of the failing banks;
The set of parameters tested is summarised in Table 10 and Table 11 for the reinsurance and
the co-insurance phases respectively.
Table 10. Parameters used for the analysis of the reinsurance phase
T
z
y
1
80%
20%
10
20%
2
80%
20%
10
20%
3
80%
20%
10
20%
1
80%
40%
10
40%
2
80%
40%
10
40%
3
80%
40%
10
40%
Note: is the share of funds that remains available to the national DGS; is the share of liquidity
shortfall that can be covered by EDIS; z and y are two parameters in the formula defining the
maximum amount (cap) of EDIS's funds that can be used by a single DGS: z is a multiple of a single
DGS resources, y is a share of the resources of EDIS.
Table 11. Parameters used for the analysis of the coinsurance phase
T
4
64%
20%
5
48%
40%
6
32%
60%
7
16%
80%
Note: is the share of funds that remains available to the national DGS; is the share of liquidity
shortfall that can be covered by EDIS; z and y are two parameters in the formula defining the
maximum amount (cap) of EDIS's funds that can be used by a single DGS: z is a multiple of a single
DGS resources, y is a share of the resources of EDIS.
Key results 4.1.3.
Considering the co-insurance phase and going towards full mutualisation, uncovered liquidity and
uncovered losses are smaller than under a fully national system, i.e. the performance of EDIS is
increasing from the start of co-insurance.
Uncovered liquidity and uncovered losses are similar under the re-insurance phase and under a fully
national system.
21
Details on the empirical analysis are available in Annex 6.6. The phase-in assessment presented in this section is based on
Euro Area countries.

35
As shown in Table 12 and Table 13, the percentage of simulations in which a fully national system is
better able to cover liquidity needs and losses is never above 50%, i.e. re-insurance as well as co-
insurance are superior independent of the assumed parameters. Re-insurance (as transitional stage),
these instances are below always 50%) would have weaknesses in particular as the financial capacity
of the EDIS fund is very limited in its start-up phase and because the liquidity and the funding
provided by EDIS in the reinsurance phase are strictly capped. The results are analogous both for
uncovered liquidity and uncovered losses.
Table 12. Simulated runs where the national system outperforms reinsurance and average size
of the uncovered liquidity shortfall or loss covered by national DGS (% of covered deposits)
T
Z
Y
Liquidity
Loss
Share
Average
Share
Average
1
80%
20%
10
20%
48%
0.003%
23%
0.002%
2
80%
20%
10
20%
45%
0.005%
27%
0.003%
3
80%
20%
10
20%
43%
0.006%
27%
0.004%
1
80%
40%
10
40%
14%
0.002%
5%
0.002%
2
80%
40%
10
40%
15%
0.003%
6%
0.002%
3
80%
40%
10
40%
13%
0.004%
10%
0.002%
Table 13. Simulated runs where the national system outperforms coinsurance and average size
of the uncovered liquidity shortfall or loss covered by national DGS (% of covered deposits)
T
Liquidity
Loss
Share
Average
Share
Average
4
64%
20%
23%
0.007%
0%
0.000%
5
48%
40%
14%
0.007%
1%
0.015%
6
32%
60%
10%
0.004%
2%
0.027%
7
16%
80%
7%
0.002%
3%
0.054%
Funding path
4.1.4.
The proposal envisages that the DIF would reach 0.8% of covered deposits of all credit institutions in
the Banking Union by 2024. If EDIS starts in 2017, as proposed by the Commission, over 8 years the
banking sector would annually contribute 12.5% of the target amount to EDIS and national schemes
combined. National funds will therefore have diminished after EDIS has reached its target level. The
funding path therefore also determines the pace at which national funds would diminish.
According to Article 74b (3) of the EDIS proposal the contributions to the DIF are spread out as
evenly as possible until the respective target is reached. Under co-insurance the funding of the DIF
increases in equal steps (see Figure 10).

36
Figure 10. EDIF build-up with EDIS contributions evenly spread over time (the white boxes
denote the share of mutualized funds against all funds collected in a given year)
This approach implies that national funds would decrease relatively smoothly, as can be seen by the
solid line in Figure 11.
0.00
0.10
0.20
0.30
0.40
0.50
0.60
0.70
0.80
3 July 2017 3 July 2018 3 July 2019 3 July 2020 3 July 2021 3 July 2022 3 July 2023 3 July 2024
1st year
Reinsurance
2nd year
Reinsurance
3rd year
Reinsurance
1st year
Co-insurance
2nd year
Co-insurance
3rd year
Co-insurance
4th year
Co-insurance
1st year
Full insurance
% of total covered deposits
Participating DGS funds EDIS funds
20%
20%
20%
36%
52%
68%
84%
100%

37
Figure 11 Evolution of EDIS funds compared to the funds of a participating DGS under
approach 1
Building up funding through equal steps also implies that the DIF is completed faster than
commensurate to its increasing share of risk under co-insurance. EDIS coverage under co-insurance
gradually increases in four steps under co-insurance (Art. 41e of the proposal):
– in the first year of co-insurance: 20%;
– in the second year of the co-insurance: 40%;
– in the third year of co-insurance: 60%;
– in the fourth year of co-insurance: 80%.
This may therefore lead to situations where a national DGS may bear a greater share of losses, in
comparison to EDIS, than the share of funding it receives from EDIS.
An alternative approach could link EDIS funding strictly to risk mutualisation, which means that
funding and mutualisation would increase in equal steps over time (see Figure 12Error! Reference
source not found.).
0.00
0.10
0.20
0.30
0.40
0.50
0.60
0.70
0.80
3 July 2017 3 July 2018 3 July 2019 3 July 2020 3 July 2021 3 July 2022 3 July 2023 3 July 2024
1st year
Reinsurance
2nd year
Reinsurance
3rd year
Reinsurance
1st year
Co-insurance
2nd year
Co-insurance
3rd year
Co-insurance
4th year
Co-insurance
1st year
Full
insurance
% of total covered deposits
EDIS funds Participating DGS funds

38
Figure 12. Funding and risk mutualisation are synchronised
This approach implies that the shares of funding that national DGS and EDIS receive during co-
insurance mirrors their corresponding share of risk. However, it also means that national funds would
decrease more sharply and display a 'cliff effect' towards the end of co-insurance, as illustrated by the
solid line in Figure 13Error! Reference source not found..
Figure 13. Evolution of EDIS funds compared to the funds of a participating DGS under
approach 2
The funding path, according to the EDIS proposal, spreads out contributions to the EDIS fund as
evenly as possible, thereby avoiding 'cliff effects', i.e. sharp decrease of national funds towards the end
of co-insurance.
0.00
0.10
0.20
0.30
0.40
0.50
0.60
0.70
0.80
3 July 2017 3 July 2018 3 July 2019 3 July 2020 3 July 2021 3 July 2022 3 July 2023 3 July 2024
1st year
Reinsurance
2nd year
Reinsurance
3rd year
Reinsurance
1st year
Co-insurance
2nd year
Co-insurance
3rd year
Co-insurance
4th year
Co-insurance
1st year
Full insurance
% of total covered deposits
Participating DGS funds EDIS funds
20%
20%
20%
20
%
40%
60%
80%
100%
0.00
0.10
0.20
0.30
0.40
0.50
0.60
0.70
0.80
3 July 2017 3 July 2018 3 July 2019 3 July 2020 3 July 2021 3 July 2022 3 July 2023 3 July 2024
1st year
Reinsurance
2nd year
Reinsurance
3rd year
Reinsurance
1st year
Co-insurance
2nd year
Co-insurance
3rd year
Co-insurance
4th year
Co-insurance
1st year
Full insurance
% of total covered deposits
EDIS funds Participating DGS funds

39
5. INTERACTION BETWEEN EDIS AND NATIONAL DISCRETIONS UNDER THE DGSD
The DGSD leaves Member States a degree of discretion for a number of features of deposit insurance,
and in particular temporary high balances and irrevocable payment commitments
22
. They were
introduced by the Council and the Parliament in the legislative process. EDIS would preserve such
discretion to the extent that it is necessary to accommodate Member States' specificities. On the other
hand, EDIS provides the framework to eliminate certain differences in national implementation, which
could impair depositor confidence and the effectiveness of the internal market. This section reviews
the interaction of the EDIS proposal with a selected list of national discretions under the DGSD.
5.1. Irrevocable payment commitments (IPC)
Issue description 5.1.1.
The current DGSD allows for irrevocable payment commitments (IPC) to be taken into account in
reaching the national DGS target level. The DGSD's definition of "available financial means" is "cash,
deposits and low-risk assets which can be liquidated within a period not exceeding that referred to in
Article 8(1)[7 days] and payment commitments up to the limit set out in Article 10(3)"
23
. The cap on
the amount of available financial means which can be constituted by irrevocable payment
commitments is 30% of "available financial means raised in accordance with this Article"
24
.
Some Member States still face DGS liabilities linked to the financial crisis, while others did not have
pre-funded DGSs. Accordingly, IPCs were included in the EU legal framework during the legislative
negotiations with the intention of providing for some flexibility during the transition period until 2024.
However, IPCs were required to be collateralised in order to ensure that the DGS could have
immediate access to funding if needed, but without the requirement on the part of the credit
institutions to provide cash entirely upfront.
Policy options and comparison 5.1.2.
Option 1: Not allowing for IPC under EDIS
Option 2: Allowing for IPC under EDIS with constraints:
o Option 2a: Allowing for IPC up to 30% of the funds raised by the DGS, as currently
provided for in the DGSD
o Option 2b: Allowing for IPC up to a lower percentage of DGS funds than under the
DGSD.
The EDIS proposal does not envisage IPC as part of the available financial means (option 1). The
acceptance of IPC in the EDIS context could be regarded as challenging for the following reasons:
i. The EBA Guidelines indicate that the accounting treatment of IPC differs under different
accounting standards. Such differences could lead to distortions of the level playing field;
ii. IPC can have pro-cyclical effects;
22
Further national discretions exist for: deposits held by personal pension schemes and occupational pension schemes of
small or medium-sized enterprises and deposits held by held by local authorities with an annual budget of up to
EUR 500 000 (Art. 5(2) DGSD).
23
Article 2(1)(12) DGSD.
24
Article 10 (3) DGSD.

40
iii. IPC can increase asset encumbrance and may limit banks’ ability to shift from unsecured to
secured funding under stressed conditions.
iv. The establishment of an EU-wide operational and risk management framework to manage the
acceptance of IPC was deemed difficult and costly.
v. The decision making process under EDIS may involve additional time constrains for a timely
7-day-pay-out.
The first three obstacles are not specific to EDIS, but apply mutatis mutandis also to national DGS.
Yet, DGS exercise the option to use IPC differently across Member States. In view of these different
practices, it is therefore necessary to assess the use of IPC in EDIS with respect to each of the five
challenges identified.
i. Accounting treatment of payment commitments
The EBA noted in its Guidelines on IPC that the accounting treatment of these commitments differs
dependent on the applicable accounting standards. Under some accounting standards, IPC would be
treated fully as a liability, whereas under other standards IPC would remain off-balance sheet.
According to the EBA, the effects on the profit and loss account also differ. To the extent that these
differences are likely to negatively impact a level playing-field in a multi-DGS context, they are even
less justifiable under EDIS. Eventually, this could lead to a situation where bank contributions are
determined according to a common methodology, but the effects of IPC profitability could vary
substantially depending on the geographical location of the bank. Furthermore, the accounting
treatment depends on the analysis made for each individual IPC arrangement. The treatment would,
inter alia, depend on (i) the probability of the commitment becoming payable and (ii) the timing and
the amount if such an event occurs.
The EBA did not intend to, nor could it, harmonize the accounting treatment via its guidelines.
Nevertheless, the EBA proposed a mitigant to preserve a level-playing field, which is that the
prudential treatment of IPC should be uniform. In particular, the prudential treatment should reflect the
probability that these commitments would be drawn upon.
If payment commitments were allowed under EDIS, it would need to be ensured that a uniform
prudential treatment would apply. Also, the circumstances and conditions under which IPC could be
drawn would need to be unambiguously defined.
ii. Pro-cyclical effects
The potential pro-cyclicality of IPC has two sources. The first source is closely related to the
accounting treatment. If existing commitments have not been accounted for, e.g. via sufficient
provisioning, the impact on banks’ earnings would only materialize once they are called upon by the
DGS. If a DGS calls the IPC in a stress situation, banks’ earnings and balance sheets could further
deteriorate. A possible mitigant, as described above, would be a uniform prudential treatment, e.g.
capital requirements that take into account the likelihood that payment commitments have to be
honoured.
A second possible source of pro-cyclicality stems from the fact that IPC are typically secured by a
limited set of high-quality collateral (e.g. government bonds). In case of a call on banks in a stress
situation, a number of banks may be forced to liquidate the collateral and hence add pressure on
market prices. This source of pro-cyclicality may also be manageable. Collateral management systems

41
exist which allow IPC to generate liquidity without liquidating the pledged securities. For example, the
Swiss DGS
25
uses tri-party collateral management arrangements
26
. Under such system it could be
possible to use pledged securities to obtain credit in the repo market rather than liquidate the securities.
iii. Asset encumbrance
Asset encumbrance can further create pro-cyclical effects, as it may limit banks’ ability to obtain
secured funding in times of stressed funding markets.
27
The EBA is intensively monitoring the level of
asset encumbrance and will publish an annual report on the subject. In its recent report of June 2016,
the EBA confirmed that there has been no indication of a significant increase in the level of asset
encumbrance in the previous year, but recommends that supervisors should carefully monitor and
investigate funding structures across the EU. If IPC were to be accepted under EDIS, they would need
to be covered by this monitoring process.
iv. Establishment of an EU wide operational and risk management framework
For all EDIS member banks to benefit equally from the use of IPC, it would be necessary for eligible
collateral to be harmonised and usable across national borders. Furthermore, in operational terms the
SRB would be required to manage the risks associated with the acceptance of collateral, including (i)
the credit risk of the accepted security, (ii) the market risk of an adverse price movement of the
accepted collateral and (iii) the liquidity risk of an adverse price movement. Currently, the SRB has
not been required to establish a comprehensive collateral management system and accepts only cash
collateral. However, there are examples of such systems, notably the mobilization channels for
collateral used within Eurosystem credit operations, as well as the Eurosystem’s risk mitigation
techniques. Setting up a properly functioning collateral management system on a cross-border basis
could facilitate the the use of IPC under EDIS.
v. The decision making process under EDIS may involve additional time constraints for a timely
7-day pay-out.
The decision-making process under EDIS may involve additional time constraints for a timely payout
within seven working days. Such constraints would include:
a. the number of days needed, according to the decision-making process under the SRMR for the
Board to decide that the conditions for coverage by EDIS have been met, and to determine the
amount of funding (Article 41(m) of the proposal), and
b. the time needed for the Board to execute the transfer order to the national DGS, and for the
cash to actually reach the latter.
Under the EBA guidelines, a credit institution would have up to two days to make available the cash
promised through an IPC. This cash would be made directly available to the DIF. The Board would
have to determine, in principle within 24 hours, that the conditions for EDIS coverage are met, and the
amount of funding to be provided
28
; the national DGS may ask for a review of the Board decision
within further 24 hours, and the Board shall decide within 24 hours more. At this point 3 days have
already elapsed. In cases where the declaration of the unavailability of deposits and the notification
under Article 41(l) happen at the same time, the 7-day pay out deadline could be compromised.
25
esisuisse, http://www.esisuisse.ch/en/home.htm
26
A product offered by clearing houses to provide collateral management for the collateral supplier for the benefit of the
collateral taker.
27
See ESRB recommendation of 20.12.2012, executive summary. http://eur-lex.europa.eu/legal-
content/EN/TXT/PDF/?uri=CELEX:32013Y0425%2801%29&from=EN
28
Article 41m of the Commission proposal.

42
Of course, the above constraints would only occur if one assumes that the notification by the DGS to
the Board under Article 41(l) takes place together with the declaration of unavailability of deposits by
the administrative or judicial authority, which is the pay-out trigger. Although one could argue that the
duty to notify according to Article 41(l) only becomes effective after the declaration of unavailability,
the board’s deliberations according to 41(m) would not need to be delayed given the duty of the
national DGS to notify already under Article 41(k) the "expected" pay-out, and then, under Article
41(l), the pay-out "encountered". In addition, it could be argued that the likelihood that the IPC has to
be realized is rather low given that this means that a single event or several events would have to
consume 70% of the DIF without time for ex-post contributions to be raised. Furthermore, time
constraints could be further mitigated if:
- the DGS or designated authority calls the IPC in a cautious manner, namely sufficiently early
before a number of pay outs involve a depletion of the fund, looking at the financial scenario
and at the likelihood of new pay-out events to arise; the way in which the DGS or designated
authority calls on the IPC is, however, neither prescribed nor governed by the current DGSD;
- the level up to which IPC are accepted is lowered, since this would reduce the likelihood to
reach the need to tap them.
Conclusion 5.1.3.
There are a number of risks associated with accepting IPC in an EDIS framework, including
operational, management and procedural risks. Those risks could be mitigated. Such mitigants would
include: (i) a prudential treatment of payment commitments that takes into account the likelihood that
they will be triggered, (ii) clear criteria under which conditions the board may call payment
commitments, (iii) a collateral and risk management framework that enables EDIS member banks to
use the same type of collateral independent of their geographical location.
When balancing the advantages and disadvantages of including IPCs in an EDIS context, the
Commission proposal has taken a conservative approach by excluding the possibility of using IPCs
towards the target level of the DIF (policy option 1). Otherwise, the definition of "available financial
means" in the proposal
29
mirrors exactly the definition in the DGSD.
5.2. Temporary high balances (THB)
Issue description 5.2.1.
Under the DGSD, the coverage level for each deposit is up to EUR 100.000. However, pursuant to
Article 6 (2) DGSD, Member States must ensure a higher level of coverage for a period of between 3
and 12 months for deposits relating to certain transactions, or serving certain social or other purposes.
The deposits in these circumstances are referred to as "temporary high balances (THB)”. More
specifically, THB under the DGSD relate to the following:
"(a) deposits resulting from real estate transactions relating to private residential properties;
(b) deposits that serve social purposes laid down in national law and are linked to particular
life events of a depositor such as marriage, divorce, retirement, dismissal, redundancy,
invalidity or death;
(c) deposits that serve purposes laid down in national law and are based on the payment of
insurance benefits or compensation for criminal injuries or wrongful conviction."
30
29
Article 3(57) of the Commission proposal.
30
Article 6(2) DGSD

43
The exact definition of the events covered varies depending on the national laws. In addition, the exact
period of protection for THB, as well as the amount protected, is to be determined by the Member
State, taking into account the significance of the protection for depositors and the living conditions in
the Member States
31
.
The discretions relating to THB in the DGSD are not affected by the EDIS proposal; THB which are
covered under the respective national law by the national DGS, would be covered by the DIF under
the EDIS proposal
32
.
Policy options and comparison 5.2.2.
Option 1: THB remain as national options and are covered by EDIS, as per the Commission's
proposal
Option 2: THB are fully harmonized and are covered by EDIS
Option 3: THB are covered by each national DGS.
Option 4: THB remain and are covered by EDIS up to a certain harmonized amount
33
and by
national DGSs for any amount beyond.
As regards the quantification of the options currently in place in Member States, covered amounts for
THB differ widely among Member States. Table 14 provides an overview of some key statistics. For
real estate transactions and insurance benefits, the average and median for the EU are relatively close,
both around EUR 500.000. However, this average/median still conceals a significant divergence in
coverage, which ranges from as low as EUR 150.000 to as high as EUR 1.300.000 (or even
‘unlimited’ for insurance benefits in 2 MS). As for the coverage period, most MS chose either a six
month coverage period or a three month coverage period. A coverage period of 12 months only
occurred incidentally.
Table 14. Summary statistics for EU
Real estate
transactions
Social purposes
Insurance
benefits/compensation
Average amount
EUR 552.000
EUR 447.000
EUR 546.000
Median amount
EUR 450.000
EUR 250.000
EUR 450.000
Lower quartile amount
EUR 200.000
EUR 150.000
EUR 150.000
Median period
6 months
6 months
6 months
Source: Survey by the Dutch Presidency of the Council – May 2016
Note: in cases where MS indicated that the coverage was unlimited, an amount of € 1.000.000 was selected for the calculations, knowing
that this amount does not affect the median. In a few instances it was not clear whether the amount mentioned included or excluded the first
€ 100.000. The Presidency had to make a judgment call, based on the wording of the response. No such instances significantly affect the
statistics.
31
Recital 26 DGSD
32
Both in re-insurance and co-insurance, the amount of covered deposits used to calculate the liquidity shortfall of the
national DGS only consists of eligible deposits up to the standard coverage level of 100,000 euro or its equivalent in
national currency. This does not mean that the proposal excludes temporary high balances from EDIS coverage in those
phases. The reason not to refer to them as basis for the calculation of the liquidity shortfall of the national DGS is that
temporary high balances are normally not yet known at the time of the payout event, and are therefore disregarded.
Indeed in both re-insurance and co-insurance and also in full insurance the loss cover of the national DGS is determined
on the basis of the total amount repaid to depositors under Article 8 of the DGSD which includes THB.
33
This could be set e.g. at EUR 500 000 which emerged as the average of the current national levels (see Dutch Presidency
non paper in May 2016).

44
In order to provide concrete figures on the possible exposure for the DIF covering THB, the
Commission addressed targeted data requests on the exposure of national DGSs to THBs in recent
pay-out events (percentage of THB of total amount repaid to depositors). Data obtained was limited
due to the relatively low number of pay-outs after Member States have incorporated THB into their
national framework, and to the fact that THB are typically not known in advance of a pay-out but need
to be "claimed" by depositors and verified after a pay-out. Nevertheless, three Member States
34
with
recent pay-outs, reported that no claims related to THB had been made. Poland has provided an
estimated ratio of THB to total pay-out based on their DGS’s analysis covering 8 entities that
experienced pay-outs in 2014-2016 (See Table 15).
Table 15. THB estimate.
Entity
Max. THB ratio
Entity 1
3,5%
Entity 2
2,5%
Entity 3
1,8%
Entity 4
0,2%
Entity 5
0,0%
Entity 6
0,1%
Entity 7
0,0%
Entity 8
0,0%
On the basis of Table 15, it could be assumed that, for listed entities, the estimated THB ratio could
range from 0.0% to 3.5%. However, given the fact that THB were incidental, it should be assumed that
the proportion of THB is rather close to zero.
Conclusion 5.2.3.
The discretions awarded by the DGSD to Member States are not affected by the EDIS proposal. The
information provided by Member States, together with the fact that THB are meant to provide cover
for exceptional events and for a limited period of time, would suggest that their magnitude is likely to
be small compared to the claims of "regular" deposits in case of a pay-out and that the policy option
adopted appears to be correct.
5.3. Scope of EDIS
The scope of EDIS determines which entities should be eligible for coverage. According to Art. 2 (2)
of the EDIS proposal, the European scheme would apply to all "credit institutions affiliated to a
participating DGS". Several Member States have suggested that the scope of EDIS should be more
clearly specified, especially with regard to:
34
DE, LV and HR

45
entities that might be covered by national DGSs (e.g. credit unions), but which are not covered
by the SRM/SSM/CRR (non-CRR entities) and
branches established in the territory of a Members State by a credit institution which has its
head office outside the European Union (third-country branches).
Non-CRR entities 5.3.1.
5.3.1.1. Issue description
The difference between the scope of EDIS and that of the SRM/SSM/CRR is of relevance. The EDIS
proposal defines a wide scope, covering all credit institutions affiliated to a DGS. Therefore, from a
formal point of view, EDIS coverage would also be provided to entities that are excluded from
applying the CRR/CRD IV rules and not covered by the SSM (non CRR entities). Table 16 provides
information on the relevant scope of DGSD, EDIS, SSMR and SRMR.
Table 16. Non-CRR entities in the context of EU legislation
Scope of DGSD
EDIS proposal
SSM- Regulation
SRM - Regulation
Non-
CRR
Entities
Yes, to the extent that
they are credit
institutions.
Art. 1 (2) (d) DGSD:
applies to "credit
institutions affiliated
to a DGS";
credit institutions are
defined in point (1) of
Art. 4(1) CRR
Yes, to the extent that
they are credit
institutions.
Art. 2(2) (b) EDIS
proposal: "Credit
institutions affiliated
to a participating
DGS"
No.
Art. 1 subpara. 2
SSMR:
"The institutions
referred to in Article
2(5) of the Directive
2013/36/EU […] are
excluded from the
supervisory tasks
conferred on ECB in
accordance with
Article 4 of this
Regulation.
No.
The scope of the
BRRD excludes credit
unions (see Art. 2 (1)
point (2) BRRD);
the SRMR builds on
the BRRD (as single
rulebook) and thus
cannot have a wider
scope of application
than the BRRD.
Moreover, the scope is
confined to SSM
supervised entities
only
Concerns may exist as certain entities to be covered by EDIS are not regulated and supervised under
the CRR/CRD framework and the SSMR. Potentially lower regulatory and supervisory standards at
national level could increase the risk exposure of EDIS. Moreover, any misalignment of the scope
would contradict the basic objective behind the Banking Union, ensuring that liability and control is
consolidated under the three pillars of the Banking Union. Table 17 provides a summary of
information collected from Member States on credit institutions potentially covered by EDIS but
outside the CRD/CRR framework and the SSMR.

46
Table 17. Non CRR entities (mn EUR)
35
MS
Type
DGS
member-
ship
SSM
Number of
entities
Total Assets
held by
entities
Total Assets
as share of
MS' banking
sector TA (in
%)
Covered
Deposits
held by
entities
Covered
Deposits as
share of total
covered
deposits (in
%)
AT
Other credit
institutions
Yes
No
14
35.466
4,00%
635
0,32%
IE
Credit unions
Yes
No
333
15.399
3,30%
12.631
16,00%
LT
Credit unions/
Central bank
Yes
Yes
1
133
0,55%
0,29
0
Credit unions
Yes
No
74
656
2,70%
552
5,00%
LV
Credit unions
Yes
No
32
25
0,08%
17
0,22%
NL
Credit unions
No
No
30
10
0,00%
0
0,00%
PT
Savings banks
Yes
No
3
379
0,09
245
0,19%
Non Banking Union Area
CZ
Credit unions
Yes
No
11
1.196
0,60%
1.004
0,90%
HU
Co-operatives
Yes
No
1
16
0,02%
4,8
0,02%
PL
Credit unions
Yes
No
45
2.769
0,72%
2.557
1,65%
UK
Credit unions
Yes
No
500
3,330
0,04%
2,88
0,23%
Based on Table 17, the following tentative assessment can be made.
9 Member States require different types of entities to join a national DGS. The most important
category concerns credit unions (7 Member States). However, not all Member States that have
credit unions require them to join a national DGS. For example in the Netherlands there is no
protection for credit union depositors. In terms of relevance, these entities are not significant
because the amount of covered deposits as a share of total covered deposits of the Netherlands
banking sector is close to zero. In Spain, credit unions are credit institutions, which fall within
the scope of the CRR. Those credit unions are significant for the Spanish banking sector:
10.5% of total banking sector covered deposits are held by 63 credit unions.
Business operations of these non-CRR entities are limited to local retail customers, and to
some extent SMEs and the agricultural sector. These entities may also be important for
financial inclusion. They often contribute to the delivery of banking and payment services to
the entire population, in particular with regard to disadvantaged or low-income segments of
the society.
In some Member States, significant numbers of non-CRR entities, in particular credit unions,
are engaged in business (UK: 500, IE: 333, LT: 75, PL: 45). However, taking into account the
share of covered deposits held by those entities at national level, a mixed picture emerges. A
significant proportion deposits are held by credit unions in IE (16%), followed by LT (5%)
and PL (1.63%). In all other cases, the percentage is below 1%. In conclusion, the question of
EDIS coverage therefore appears to be of particular relevance for one Member State (IE).
35
The information in this table is based on information provided by Member States. LU provided no data. RO informed on
credit unions not affiliated to a DGS but not provided further information.

47
5.3.1.2. Policy options and comparison
Two options can be assessed:
Option 1: exclude entities not covered by CRR and not supervised by the SSM from EDIS
coverage
Option 2: Include entities not covered by CRR under EDIS. It could be explicitly clarified that
all credit institutions, including the ones exempted in Article 2(5) CRDIV in so far as they
have been included in the scope of a national DGS would be eligible for coverage by EDIS
Option 1 would be in line with the philosophy of the Banking Union where access to common funds is
preconditioned on their supervision within the SSM. On the other hand, their exclusion could lead to
an unlevel playing field within a Member State between institutions only covered by the national DGS
and those covered by EDIS ('two-tier system'). One possibility could be to apply the CRR framework
to such entities as it is already the case in Spain. This could however be challenging for such entities
considering their size and limited business operations. Exclusion of these entities would require most
of the Member States concerned to maintain separate DGS for a very limited number of entities after
the full implementation of EDIS in 2024. (For example, in PT a separate DGS would be required to
cover only 3 entities with covered deposits of 245mn EUR.) This raises questions in terms of cost
efficiency and effectiveness, with the gap between depositors protected by EDIS and depositors
protected by national DGSs reinforcing a two-tier system.
Option 2 would support simplicity and would maintain the level playing field within Member States.
All entities affiliated to a DGS would be eligible for EDIS coverage and all depositors could profit
from the protection provided in the same way. However, their inclusion raises questions about
conceptual consistency with the Banking Union and particularly aligning liability and control. Sub-
optimal regulatory and supervisory standards at national level could increase the risk to EDIS.
5.3.1.3. Conclusion
In light of the different pros and cons, the EDIS proposal applies to all credit institutions affiliated to a
participating DGS.
Third-country branches 5.3.2.
5.3.2.1. Issue description
According to Art. 15 (1) DGSD, Member States are required to check whether third-country branches
have protection equivalent to that prescribed in the DGSD. They should at least check that depositors
benefit from the same coverage level and scope of protection as provided by the DGSD. Although the
equivalence test is mandatory, Member States have discretion in deciding whether to oblige the third-
country branch to join a national DGS, i.e. a negative equivalence test does not automatically mean
that a third-country branch is required to join a national DGS
36
. If a Member State requires a third-
country branch to join the national DGS, the branch would be covered by EDIS (Art. 2 (2) of the EDIS
proposal). The scope of EDIS does not fully align with the SSM, as national supervisory authorities
remain responsible for carrying out tasks not conferred on the ECB, including the supervision of third-
countries. To align liability and control, some Member States prefer the exclusion of third-country
branches from EDIS support. Table 18 provides an overview on the number of third-country branches
in the Members States and their treatment in the context of equivalence test.
36
Third-country branches not joining a national DGS are obliged to provide all relevant information concerning the guarantee
arrangements to their actual or intending depositors (Art. 15 (2), (3) DGSD.

48
Table 18. Third-country branches and equivalence
37
Total number of third-
country branches
Not equivalent
and covered by
the national DGS
Not equivalent and not
covered by the
national DGS
Equivalent and not covered
by the national DGS
AT
0
0
0
0
BE
8
8
0
0
CY
15
15
0
0
DE
19
19
0
0
EE
0
0
0
0
EL
4
4
0
0
ES
5
5
0
0
FI
0
0
0
0
FR
20
20
0
0
IE
0
0
0
0
IT
8
4
N/A
N/A
LT
0
0
0
0
LU
11
11
0
0
LV
0
0
0
0
MT
2
0
2
0
NL
4
0
4
0
PT
1
1
0
0
SI
0
0
0
0
SK
0
0
0
0
∑ BU
97
91
6
0
Non Banking Union Area
BG
1
1
0
0
CZ
0
0
0
0
DK
0
0
0
0
HR
0
0
0
0
HU
1
1
0
0
PL
0
0
0
0
RO
0
0
0
0
SE
0
0
0
0
UK
50
50
0
0
∑ Non BU
52
52
0
0
∑ EU
149
143
6
0
The table shows that a vast majority of the Member States expect third-country branches to join a
national DGS. No Member State classifies the protection level as equivalent. However, in two cases,
third-country branches are classified as not equivalent but are not required to join a national DGS
(Netherlands, Malta). Whereas the amount of deposits as a share of the total banking sector deposits is
37
The information in this table is based on information provided by Member States. One Member States submitted
incomplete data (IT).

49
very low in the Netherlands (4 branches with a share of only 0.18%). The situation is rather different
in Malta (2 branches with a share of 20.7%)
38
. Table 19 provides information on the relevance of
third-country branches required to join a national DGS in the Member States concerned.
Table19. Relevant third-country branches – Key statistics
39
MS
Number
TA held by
third-
country
branches (in
mn)
TA as share
of MS's
consolidated
banking
sector TA (in
%)
Deposits held
by the third-
country
branches (in
mn)
Deposits as
share of total
banking
sector
deposits (in
%)
Covered
deposits held
by third-
country
branches (in
mn)
Covered
deposits as
share of total
covered
deposits (in
%)
BE
8
89,026
8.79%
27,886
3.99%
73
0.02%
CY
15
3,166
4.80%
3,029
5,2%
203
0,80%
DE
19
52,045
0.65%
12,564
0.34%
346
0.07%
EL
4
688
0.18%
471
0.17%
96
0.10%
ES
5
5,097
0.14%
1,481
0.07%
159
0.02%
FR
20
40,000
0.50%
8,000
0.50%
200
0.10%
IT
4
2,416
0.07%
1,076
0.05%
N/A
N/A
LU
11
47,550
6.40%
31,582
6,45%
170
0,59%
PT
1
134
0.03%
112
0.05%
22
0.02%
Non-Banking Union area
BG
1
46
0.10%
31
0.08%
29
0.09%
HU
1
2,399
2.29%
0
0.00%
0
0.00%
UK
50
1,754,456
22.00%
N/A
N/A
4,310
0.34%
The table illustrates that third-country branches (required to join a national DGS) are of high
importance in a few Member States, in particular in the UK and BE. However, looking only at the
covered deposits a different picture emerges. The amount of covered deposits, as a share of total
covered deposits, is below 1% in all Member States. Deposit-taking by these branches is rather
concentrated on wholesale depositors in some Member States (see large shares of total deposits in BE,
LU).
Since Art. 2 (2) of the EDIS proposal provides that the Regulation should apply to "credit institutions
affiliated to a participating DGS", this means that if a Member State required the third-country branch
to join the national DGS, the branch would automatically be covered by EDIS. It is recalled that the
scope of EDIS does not fully align with the SSM/SRM, as national supervisory authorities remain
responsible for carrying out tasks not conferred on the ECB, including, supervising credit institutions
from third countries establishing a branch.
Given the exposure for EDIS of covering deposit from third country branches, the options below can
be considered.
5.3.2.2. Policy options and comparison
Four options have been considered:
38
Data on "covered deposits" are not available according to the replies of MT and NL.
39
The information in this table is based on information provided by Member States..
50
Option 1: retain the current approach: Member States continue to apply the equivalence test
and decide whether a third-country branch must participate in the national DGS and so be
covered by EDIS.
Option 2: retain the current approach but specify criteria for the equivalence test through a
Commission delegated act.
Option 3: conduct the equivalence test at a central level (SRB or Commission). The central
body at European level could then inform the Member State of the outcome of the equivalence
test, so that the Member State or competent authority in that Member State would decide
based on the outcome of that test to require a third country branch to join a national DGS or
not.
Option 4: same as option 3 but the third country branch would be required to join the DGS in
case of non-equivalence, i.e. the outcome of the equivalence test would be binding for the
Member State or the competent authority concerned.
Option 1 respects the discretion granted by the DGSD to Member States as regards third country
branches. The equivalence test and procedure as well as the final decision would remain at national
discretion. Differences in application between Member States cannot be fully excluded.
Based on a set of binding guidelines, Option 2 would contribute to a more harmonized procedure at
national level. Indeed, the requirements provided by the DGSD are not very detailed leaving room for
different interpretation ("When performing the check provided for in the first subparagraph of this
paragraph, Member states shall at least check that depositors benefit from the same coverage level and
scope of protection as provided for in this Directive"). Nevertheless, execution as well as decision-
making would remain at national level only. Differences between Member States can therefore not be
fully excluded.
Option 3 would contribute to a more harmonized procedure when assessing equivalence. The
equivalence check would be exercised by a central body at European level supporting a uniform
assessment. Potential differences in the assessment between Member States could be widely
eliminated. Moreover, to concentrate the assessment at central level might create synergies and
accordingly reduce administrative costs. However, it would be not fully effective as to creating a level
playing field as the final decision on the DGS membership would remain a discretionary decision of
the Member State. Although the vast majority of Member States requires non-equivalent branches to
join their respective DGS there are some exemptions: Six branches out of two Member States (MT,
NL) are currently classified as non-equivalent and therefore not required to join a national DGS.
Option 4 would eliminate any discretionary power of Member States when it comes to the decision on
DGS membership. Assessment as well as decision-making would be de facto executed centrally and
may lead to a more harmonized level of protection of depositors across all Euro Area Member States.
However, under this option, the underlying criteria of the equivalence test may have to be strengthened
to reflect the higher protection provided under EDIS compared to a purely national system. In
particular, the specific risk of the third-country branch to EDIS should be part of the equivalence test.
Moreover, it should be taken into account that the supervision of third-country branches unlike
European credit institutions or subsidiaries of credit institutions, falls in the remit of national
competent authorities with no control from the ECB and with a great deal of room for manoeuvre to
grant prudential exemptions to third-country branches. The equivalence test would therefore also
include the assessment of supervision.

51
5.3.2.3. Conclusion
The EDIS proposal respects the discretion granted by the DGSD to Member States as regards the
equivalence test of deposit protection for third country branches.
5.4. EDIS cover in case of alternative and preventive measures
Issue description 5.4.1.
As explained in Chapter 2, the DGSD provides for two mandatory functions of any DGS regarding the
use of funds: a pay-out function and participation of the DGS in resolution. Under the Commission
proposal, EDIS support would cover both types of interventions.
Beyond this, the DGSD also includes an option for Member States' to provide for two additional
functions of a DGS.
First, Member States may allow DGS to use their financial means in order to prevent failure of an
institution subject to certain conditions and safeguards (preventive measures, Art. 11 (3) DGSD).
More concretely, if the DGS's financing of the measure constitutes State aid, in particular if the
decision to provide funding is formally or informally controlled by the State ("imputable to the state"),
the institution in question would be considered failing or likely to fail (Art. 32 (4) BRRD). In such
case, if no alternative private sector or supervisory measure could prevent the failure
40
, the bank needs
to go into insolvency or, if this better achieves the resolution objectives, into resolution (Art. 32 (5)
BRRD). In practice, this is means that the use of funds to finance alternative preventive measures
without triggering resolution, is often limited to financing by purely private structures, such as
institutional protection schemes which have also been entrusted with statutory DGS functions.
Second, Member States may provide for the possibility of their DGS to finance deposit book transfer
and eventually other assets and liabilities in order to preserve the access of depositors to covered
deposits, in the context of national insolvency proceedings (alternative measures, Art. 11 (6) DGSD).
This use of national DGS is subject to the condition that the use of their funds does not exceed the net
amount of compensating covered depositors at the credit institution concerned ("least cost principle").
Both the use of the DGS to finance preventive measures as well as the use of the DGS to finance
alternative measures remains an option for Member States under the DGSD, but would not be funded
under EDIS as per the Commission proposal.
The tables below provide an overview of the Member States which exercise those options.
40
If the use of a DGS is considered State aid, it could not amount to a "private sector measure" under Article 32(1) (b)
BRRD.

52
Table 20. BU countries
41
Incorporated alternative
measures as an option into
the legislation (Art. 11 (6)
DGSD)
Have used
this option
in the past
Incorporated preventive
measures as an option into
the legislation (Art. 11 (3)
DGSD)
Have private DGS (s)
which could potentially
perform preventive
measures
AT
No
No
Yes
No (not yet)
BE
Yes
No
NO
No
CY
No
No
No
No
DE
Not used
Yes but only for Institutional
Protection Schemes which are
recognizes as a DGS
EE
Not used
Not used
EL
Yes
42
No
No
No
ES
No
No
Yes. Art. 11(5) Royal Decree-
law 16/2011 and articles 10
and 11 Royal Decree
2606/1996.
FI
FR
No
No
Yes (and we have used this
option in the past)
No
43
IE
Yes
No
Yes
No
IT
Yes
Yes
Yes
Yes
LT
Option not exercised
Option not exercised
LU
LV
No
No
No
No
MT
Yes. Reg 33(6) of the
Depositor Compensation
No
Yes. Reg 33(3) of the
Depositor Compensation
No
41
The information in this table is based on information provided by Member States. Blank cases correspond to non-
confirmed information.
42
Please note that the transposition of the provision of Art 11(6) of DGSD in Greek legislation does not provide for
transfer of assets and liabilities but is limited to deposit book transfer. It is not meant to be used as an alternative
measure but as an additional means for reimbursing depositors. The relevant provision in the Greek legislation is as
follows:
“Alternatively, instead of repayment, the access of depositors to covered deposits may be preserved by deposit book
transfer, provided that the cost to TEKE [Hellenic Deposit and Investment Guarantee Fund] does not exceed the net
amount it would repay to the depositors of the relevant credit institution.” - Art 11(10) of law 4370/2016 (Government
Gazette A’ 37).
43
France does not have an IPS system. However they refer to the French DGS as established by the law and administered by
the participating members who regard the funds as private money collected on banks.

53
Scheme Regulations, 2015
(L.N. 383 of 2015)
Scheme Regulations, 2015
(L.N. 383 of 2015)
NL
No
No
No
No
PT
Sl
No
No
No
No
SK
No
No
No
No
Table 21. Non-Banking Union area
44
Incorporated alternative
measures as an option
into the legislation (Art.
11 (6) DGSD)
Have used
this option
in the past
Incorporated preventive
measures as an option
into the legislation (Art.
11 (3) DGSD)
Have private DGS (s)
which could
potentially perform
preventive measures
BG
No
No
No
No
CZ
No
No
No
No
CZ
No
No
No
No
DK
Yes
Yes
HR
No
n/a
Yes
No
HU
No
Yes
No
No
PL
No
No
Yes
No
45
RO
No
No
No
No
SE
Never used
Never used
UK
Yes
Yes (pre-
DGSD)
No
No
As suggested by Table 20 and 21, there is:
a. a limited number of Member States have private DGS which could be used for preventative
measures under Article 11 (3) of the DGSD (DE, AT).
b. a limited number of Member States use their DGS in order to finance alternative measures
under Article 11 (6) of the DSGD (IT, HU, DK); and
The Member States which have availed themselves of the option regarding preventative measures are
AT and DE for their Institutional Protection Schemes (IPSs). The savings banks and cooperative banks
44
The information in this table is based on information provided by Member States. Blank cases correspond to non-
confirmed information.
45
* According to ESA 2010 and statistical classification of the Bank Guarantee Fund (Polish DGS), the Fund is classified in
the general government sector (S.13).

54
in these two Member States operate mutual and contractual 'institutional protection schemes (IPS)' that
guarantee the entire liquidity and solvency of their member banks.
Policy options and comparison 5.4.2.
As it is shown in Table 20 and Table 21, there is a very limited number of countries which use their
DGS for preventative or alternative functions. This raises a number of questions as to the pertinence of
those functions being covered by EDIS.
Three policy options exist:
Option 1: EDIS would fund also alternative and preventive measures.
Option 2: EDIS would not fund alternative and preventive measures but discretion remains for
Member States to fund them through national DGS (approach in the Commission proposal).
Option 3: EDIS would support only certain types of alternative measures, e.g. an EDIS
contribution limited to a deposit book transfer, but would not be available for a transfer of
other assets and liabilities.
Under option 1, the use of the DGS to cover for the costs of alternative and preventive measures would
remain an option for the Member States under the DGSD. EDIS coverage in those instances would
mutualize expenditures the extent and the type of which would be exclusively decided by each
Member State without any input or control by the central body (SRB).
In the case of temporary high balances, another national discretion under the DGSD, the discretion is
widely exercised by Member States to different degrees (see section on Temporary high balances
(THB)). Therefore, it is possible in that case to explore common grounds of coverage by EDIS on the
basis of averages or medians of the amounts currently covered by the DGS of each Member State.
This situation differs from the use of EDIS to fund alternative or preventive measures, which is
exercised by a very limited number of Member States and where it does not therefore seem possible to
explore the same course of action.
Option 2 would still give the Member States the option of including alternative and/or preventive
measures in their national systems, but without access to EDIS for such function. In this case, national
DGS might find it difficult to fund those interventions if a large portion of their funds is allocated to
the central level. In order to allow national DGS to continue funding these measures, it can be argued
that it is necessary to reduce contributions of institutions to EDIS whose DGS/IPS finance those
functions in view of the fact that exposure of EDIS is reduced. However, such a reduction, in view of
risk/based contributions is only possible if it can indeed be shown that the membership in a DGS/IPS
with the possibilities of preventive/alternative measures indeed reduces a bank's riskiness.
It has been pointed out that membership in an IPS should be taken as a risk-mitigating factor which
would lead to a lower risk-base for these banks. This reflects the main function of an IPS which aims
at preventing banks from failing before a pay-out event occurs. This important feature is also
recognised in the DGSD, which gives Member States the possibility to allow that DGS ex-ante
contributions to be used for failure-prevention measures, as long as the available financial means of a
DGS do not fall below 25% of the target level. This possibility applies to cases where the IPS is
recognised as a DGS (Article 11(3). If banks are members of an IPS, which is separate from a DGS,
Member States may decide that these members of an IPS may pay lower contributions to the DGS
(Art. 13(1)). While the savings and cooperative banks are covered by EDIS, their specific risk profile
could be appropriately reflected under the system of risk-based contributions. When designing a
scheme for risk-based contributions for the purpose of EDIS, the effectiveness of IPS in reducing the

55
risk that EDIS would need to make payments for depositor compensation should be assessed. In
particular, their propensity to triggering a DGS requiring pay-outs or resolution contributions would
need to be appropriately reflected. If it can be demonstrated that IPS can indeed be an effective risk-
mitigation tool also in EDIS, this should be reflected in the calculation method for contributions. This
is already reflected to a certain extent in the EBA Guidelines for risk-based contributions.
The EDIS proposal requires the Commission to adopt a delegated act specifying the method for the
calculation of the calculations and reflecting the degree of risk incurred by each institution (Art 74c (5)
of the Commission proposal (see also below section 5.5 Contributions).
Option 3 would mean EDIS coverage of part of the amount which is allowed to be covered by national
DGS under Article 11 (6) of DGSD, namely the costs resulting from the transfer of the deposit book.
Under Article 109 BRRD, it is accepted that DGS could intervene to cover for the amount of losses
that covered deposits would have suffered had they not been excluded from bail-in. In resolution this
can involve DGS financing a deposit book transfer, for instance, to a bridge bank. Option 3 would
mean acknowledging that the cost of a deposit book transfer in both resolution and insolvency would
be comparable, as long as the national insolvency proceeding in question involves the same level of
loss absorption for capital and other debt holders than resolution under BRRD. In any event, the
ultimate cap of EDIS coverage under option 3 would be "the net amount of compensating covered
depositors at the credit institution concerned" (Article 11 (6) DGSD in fine).
As regards the use of the DGS to finance alternative measures, the Commission has declared it as
being compatible with the State Aid framework in the past, for instance in the case of Banca Romagna
Cooperativa
46
. Mirroring the reasoning above on the use of preventative measures, the question could
be raised as to possible reduced contributions in as much as financing of those measures with the
national DGS would reduce EDIS' exposure. The difference, however, is that use of IPS to finance
preventative measures depends on the decision of institutions to pull resources together, whilst
coverage of alternative measures by the national DGS is a public national decision which does not
involve institutions' decision.
Conclusion 5.4.3.
As suggested above, since preventative and alternative measures are used by a limited number of
Member States, the Commission services did not consider those to be core functions financed by
EDIS. Furthermore, since those functions are not clearly defined in advance at EU level, EDIS would
have to contribute to interventions that are not clearly identifiable in advance. Against this
background, the Commission did not include them EDIS coverage of preventative and alternative
functions in the proposal. In any event, Member States would remain free to finance those measures
through their national system.
However, in case an agreement could be found what the maximum exposure should be for EDIS and
in view of the claim that a deposit book transfer could in fact limit the exposure of EDIS, the issue
might have to be revisited in the course of the negotiations.
46
http://europa.eu/rapid/press-release_STATEMENT-15-5409_en.htm

56
5.5. Contributions
Issue description 5.5.1.
The DGSD requires contributions from credit institutions to national DGSs, based on their respective
holdings of covered deposits and their specific risk profile (Article 13 (1) DGSD). The likelihood that
EDIS may have to mobilise funds to compensate depositors of a failed bank increases with the
risk of that bank. Hence, the EDIS proposal envisages in Article 74 (c) to risk-adjust contributions
according to banks’ risks, thereby continuing the principle already established by the DGSD. The
EBA issued a set of guidelines specifying methods to calculate the contributions to DGSs.
Article 74c (5) of the Commision proposal empowers the Commission to adopt two delegated acts in
order to specify risk-based methodologies for the calculation of contributions for both the reinsurance
phase and the co-insurance phase
47
:
Under the re-insurance phase, the calculation must be based on the amount of covered deposits
and the degree of risk incurred relative to all other credit institutions affiliated to the same
participating DGS, i.e. the relative risk of institutions will be determined only at the national
level.
Starting with the co-insurance period, the calculation must be based on the amount of covered
deposits and the degree of risk incurred by each credit institution relative to all other credit
institutions affiliated to DGSs under EDIS, i.e. the relative risk of institutions will be
determined at the Banking Union level.
This approach follows the logic that under re-insurance the larger part of risk is still borne at the
national DGS level; this changes under co-insurance with increasing risk mutualisation.
Policy options and comparison 5.5.2.
The following policy options for determining risk-based contributions to EDIS could be considered:
Option 1: Retain current approach, i.e. each DGS would calculate risk-based contributions at
national level on the basis of the EBA guidelines specifying Article 13 (1) DGSD. There
would be no need for further delegated acts. Instead, a certain amount of contributions would
be contributed to EDIS based on national-level risk profiles of banks.
Option 2: Only one delegated act would be adopted prescribing a methodology for calculating
contributions at national level only. Thus, the method for calculating risk-based contributions
would be harmonised but would be based on national-level risk profiles of banks.
Option 3: Only one delegated act would be adopted containing provisions for the calculation
of contributions based on Banking-Union level risk profiles of banks from the outset of EDIS.
Option 4: following the proposed two stage approach, i.e. for the re-insurance phase
contributions would be calculated based on national-level risk profiles of the banks, whereas
from the start of the co-insurance calculation contributions would be based on Banking-Union
level risk profiles.
The four options have been tested against three criteria: (i) the complexity of the rules, (ii) the
alignment of the risk that banks represent and the magnitude of contributions they have to pay, as well
47
NB: this part of the analysis covers the approaches of re- and coinsurance as per the Commission proposal, while Chapter 3
refers to different concepts.

57
as (iii) the implementation costs. The table below summarizes the options compared to a scenario
(option 1) where the current system with a calculation method based on the EBA guidelines at national
level would be continued under all EDIS phases.
Table 22 Comparison of policy options
EFFECTIVENESS
Cost-Efficiency
Objectives
Policy option
Complexity of the
rules
Alignment of
banks’ risk
and
contributions
Implementation cost for
national DGS, EDIS and banks
Option 1: No
policy change
None
None
None
Option 2
-
--
-
Option 3
None
-
None
Option 4
None
++
None
The most disadvantageous option under the criteria is option 2. It would be complex because a
delegated act would need to set out a distribution mechanism for contributions at several national
levels, which would in aggregate however need to yield a predefined aggregate amount to reach a
common target level. This would inevitably imply an iterative process for the calculation with the need
for reconciliation between steps. At the same time, banks’ contributions would mirror their risk only
compared to their national peers. It would however ignore the systemic risk and not reflect banks’
relative risk for EDIS.
Option 3 is less complex to implement, but has a comparable disadvantage in the first years of re-
insurance regarding the alignment of risk and contributions. While under re-insurance risk would still
mainly be borne at the national level, under this option calculations would mirror the relative risk at
Banking Union level immediately. This could lead to situations where in aggregate banks in certain
markets could pay more to EDIS then their level of protection from EDIS would justify.
Option 4, as included in the EDIS proposal, ensures that banks’ contributions mirror the risk they
represent at the level where this risk is (mostly) covered, while providing a clear and straightforward
methodology suitable for all EDIS phases.
Conclusion 5.5.3.
The risk-weighting of contributions will change the amount of contributions paid by individual banks,
compared to a system where contributions were only determined by a size-related criteria. This is
justified because a bank’s contributions to deposit insurance should be aligned with the risk that its
depositors might need to be compensated by deposit insurance. Throughout the different phases of
EDIS, that risk is borne at the national and the Banking Union level to different degrees.
In the reinsurance phase of EDIS, where risks remain largely at the level of the (national) DGS, a
bank’s risk profile relative to the its (national) DGS peer group should determine its risk-base for the
purpose of calculating contributions. When EDIS becomes a system with joint liability at Banking
Union level, starting with co-insurance, an individual bank’s risk-base should be determined relative to
all banks in the Banking Union.
58

59
6. ANNEXES
6.1. Modelling expected losses for EDIS vs other risk pooling models
* There are n countries with m
j
banks in each country. m
j
is country dependant.
* The probabilities of failure for the banks in the system can be given by the following matrix:
Country (j)
Bank (i)
1
2
………
n
1
p
11
p
12
……….
p
1m
2
p
21
p
22
……….
p
2m
.
.
.
.
.
.
.
.
.
.
.
p
ij
.
.
.
.
p
n11
p
n22
……….
p
nm
* The possible losses/costs in the case of failure (the covered deposits) can be given by the following matrix:
Country (j)
Bank (i)
1
2
………
n
1
L
11
L
12
……….
L
1n
2
L
21
L
22
……….
L
2n
.
.
.
.
.
.
.
.
.
.
.
L
ij
.
.
.
.
L
m11
L
m22
……….
L
mn
1. The case of multiple DGSs:
* The expected loss for each DGS can be given as follows:
* The expected loss for the whole system is the weighted average of the expected losses of all the DGSs. The
weight assigned for each DGS (w
j
) is the proportion of the possible loss for that DGS to the total possible loss of
all the DGSs. Hence, the expected loss for the whole system is:
Where
is the level of deposits covered by the national DGS.

60
2. The case of a single DGS:
* The expected loss for the whole system in this case is the weighted average of the possible losses of all the
banks. The weight assigned for each bank (w
i
) is the proportion of the possible loss for that bank to the total
possible loss of all the banks. In other words, the expected loss for the whole system is:
Where
is the level of covered deposits per bank.
* Since w
j
≤ w
i
(the size of covered deposits in one bank in a DGS is smaller than the size of covered deposits in
that DGS):
* Generally, the expected loss under the single DGS scenario would be lower than that under the multiple DGSs
scenario unless:
- there was only one bank in every DGS.
- the probabilities of default across banks are perfectly positively correlated.
Example:
Assume we have only 2 countries with 3 banks in each country. The probabilities of failure and the covered
deposits are given as follows:
Country
Bank
Probability of
default
Covered
Deposits
w
j
w
i
1
1
0.05
100
0.6
100/300 = 1/3
1
2
0.01
50
50/300 = 1/6
1
3
0.01
30
30/300 = 1/10
2
1
0.02
30
0.4
30/300 = 1/10
2
2
0.01
50
50/300 = 1/6
2
3
0.01
40
40/300 = 2/15
1. Expected loss under multiple DGSs scenario
2. Expected loss under single DGS scenario

61

62
6.2. Brief description of the data sample and the simulation exercise in SYMBOL
Sample description
The data used for the present exercise is as of 2013. The data provider is Bankscope, a proprietary
database of banks’ financial statements produced by Bureau van Dijk. The dataset covers a sample of
around 3,400 banks from the EU28, representing 99.86% of EU28 banks’ total assets.
48
We focus on
total assets, risk-weighted assets and total capital and/or capital ratios, as well as customer deposits.
Missing values are imputed through robust statistics (see Cannas et al. (2013)
49
).
Data on the amount of covered deposits held by each bank are not provided by Bankscope. Hence, we
resort to alternative sources, namely we make use of statistics at country level elaborated by the JRC
(see Cannas et al (2015)
50
for details on the estimation techniques). We estimate the amount of
customer deposits held by each bank by computing the ratio of covered deposits over customer
deposits at the country level and then applying this proportion the customer deposit figures provided
by Bankscope. Table 23 shows aggregated values for some selected variables.
Table 23: 2013 aggregated unconsolidated amount of selected variables for the banks in the
sample
Number of
banks
Total assets
bn€
RWA bn€
Covered
deposits bn€
Capital bn€
2013
3,359
38,144
14,635
6,474
1,939
Data are corrected to reflect the Basel III definitions of capital and risk weighted assets. Corrections
are based on the European Banking Authority and the Committee of European Banking Supervisors
yearly exercises (Quantitative Impact Study, QIS), assessing and monitoring the impact of the new
capital standards on European banks’ balance sheet data
51
. In particular, the studies estimate what
would be the average correction factor to move from reported capital and risk-weighted assets to a
framework compliant with the new rules. For clarity purposes, Table 24 shows the correction factors
applied to the 2013 balance sheet data.
Table 24: Correction factors applied to capital and RWA
G1 banks
Tier1 K > 3bn€
G2 banks
Tier1 K < 3bn€
G2 banks Medium
1.5bn€ < Tier1 K <
3bn€
G2 banks Small
Tier1 K < 1.5bn€
Capital
correction
0.8
0.86
0.85
0.87
RWA correction
1.1
1.11
1.12
1.05
48
We use the amount of total assets in the banking sector excluding branches as provided by ECB as reference for the
population.
49
See Cannas, G., Cariboni, J., Naltsidis, M., Pagano, A., Petracco Giudici, M. (2013). 2012 EU 27 banking sector database
and SYMBOL simulations analyses, JRC Scientific and Technical Report JRC 86395.
50
Cannas G., Cariboni J., Di Girolamo F., Maccaferri S. (2015): Updated estimates of EU total, eligible an covered deposits,
JRC technical report JRC97362 (forthcoming)
51
See European Banking Authority (2014) for 2013 data.

63
6.3. Brief description of SYMBOL
The Systemic Model of Banking Originated Losses (SYMBOL) model has been developed by JRC in
cooperation with members of academia and representatives of DG FISMA. The original article
describing the working of the model appeared in the peer-reviewed Journal of Financial Services
Research.
52
The core of the model is the Fundamental Internal Risk Based formula from the Basel III regulatory
framework. The Basel III Fundamental Internal Risk Based formula works on the idea that credit
assets outcomes fundamentally depend on a single factor.
53
This allows modelling and simulations to
be carried out very easily. The formula has two additional useful characteristics in terms of modelling:
(a) it uses a very limited number of parameters expressing the riskiness of credit assets and their
correlation; (b) it gives comparable results when used on a set of sub-portfolios of assets, each with its
own parameters, and then summing up results, or when directly considering the whole portfolio using
average parameters values.
The model thus assumes that: (a) the Basel 3 regulatory model for credit risk is correct; (b) banks
report risks accurately and in line with this model;
54
(c) all risks in the bank can be represented as a
single portfolio of credit risks.
55
It is then possible to use publicly available data on total regulatory
capital, risk weighted assets and total assets to obtain parameters representing the average riskiness of
each bank’s portfolio of assets.
56
Once parameters are obtained for all banks, a set of loss scenarios are simulated. In each scenario, a
number representing a realization of the single risk factor is randomly generated for each bank. To
represent the fact that banks all operate in the same economy, the risk factors are correlated between
themselves.
Given the realisation of the risk factors and the parameters above, it is possible to obtain from the
model a simulated loss for each bank in each loss scenario.
57
These losses can then be applied to bank
capital to see which banks “default” (i.e. exhaust or severely deplete regulatory capital) in the
simulated scenario. If the policy set-up allows for or any other loss-absorbing or re-capitalization tool
(e.g. bail-in) these can also be applied at individual bank level. Losses, interventions of other tools and
counts of defaults can then be aggregated across the whole banking sector. Moreover, given that the
simulations work at individual bank level, other characteristics of banks subject to “default” can be
tracked, such as covered deposits or total assets held.
58
Given a sufficient number of loss scenario simulations (hundreds of thousands to millions), it is
possible to obtain statistical distributions of outcomes for the banking sector as a whole.
52
R. De Lisa, S. Zedda, F. Vallascas, F. Campolongo, M. Marchesi; “Modelling Deposit Insurance Scheme Losses in a Basel
2 Framework”; Journal of Financial Services Research; December 2011, Volume 40, Issue 3, pp 123-141. First Online
November 2010. Please note that at the time of submission the acronym SYMBOL was not yet employed.
53
In a very simplified way: given the general situation of the economy, each asset will have a certain probability of
defaulting. By considering such probabilities of default as the expected loss conditional on the economic situation and
summing across assets it is possible to obtain an expected loss of the portfolio conditional on any economic scenario.
The capital requirement is then the loss on a particularly adverse scenario. (See also footnote 7).
54
When this is not the case, we need to rely on self-reported or supervisory assessments of the correction that would be
needed when moving from the current system to a Basel III compatible system. It should be noted that the original
framework of the model employed Basel II (and not III) compatible data, as this was the regulatory framework of
reference at the time.
55
This does not mean that other risks are not considered, simply that they can be “mapped” in credit risk terms and modelled
using the same framework.
56
Other parameters are fixed at the default levels set in the regulation.
57
It should be noted that SYMBOL is a “purely static” model. Losses are all realized (or known) at the same point in time for
all systems’ participants and banks do not dynamically react to events.
58
It is important to stress that, though the model simulates losses at individual bank level, individual bank results are not
deemed to be usable per se.

64
It is finally possible to use such distribution to estimate the probability of events such as the
probability that losses in excess of capital will be above a certain threshold (i.e. the statistical
distribution of losses for resolution tools and/or public interventions), or the probability that banks
holding more than a certain amount of covered deposits will be in default (i.e. the statistical
distribution of intervention needs for the DGS).
59
SYMBOL simulates the distribution of losses in excess of banks’ capital within a banking system
(usually a country) by aggregating individual banks' losses. Individual banks' losses are generated via
Monte Carlo simulation using the Basel FIRB loss distribution function. This function is based on the
Vasicek model (see Vasicek, 2002), which in broad terms extends the Merton model (see Merton,
1974) to a portfolio of borrowers.
60
Simulated losses are based on an estimate of the average default
probability of the portfolio of assets of any individual bank, which is derived from data on banks'
Minimum Capital Requirements (MCR) and Total Assets (TA).
The model includes also a module for simulating direct contagion between banks, via the interbank
lending market. In this case, additional losses due to a contagion mechanism are added on top of the
losses generated via Monte Carlo simulation, potentially leading to further bank defaults (see also Step
4 below). The contagion module can be turned off or on depending on the scope of the analysis and
details of the simulated scenario.
In addition to bank capital, the model can take into account the existence of a safety net for bank
recovery and resolution, where bail-in, DGS, and RF intervene to cover losses exceeding bank capital
before they can hit Public Finances.
Estimations are based on the following assumptions:
SYMBOL approximates all risks as if they were credit risk; no other risk categories (e.g.
market, liquidity or counterparty risks) are explicitly considered;
SYMBOL implicitly assumes that the FIRB formula adequately represents (credit) risks that
banks are exposed to;
Banks in the system are correlated with the same factor (see Step 2 below);
All events happen at the same time, i.e. there is no sequencing in the simulated events, except when
contagion between banks is considered.
STEP 1: Estimation of the Implied Obligor Probability of Default of the portfolio of each
individual bank.
The main ingredient of the model is the average implied obligor probability of default of a bank. It is a
single parameter describing its entire loss distribution. It is obtained by numerical inversion of the
Basel IRB formula for credit risk, based on total minimum capital requirements declared in the
balance sheet. Individual bank data needed to estimate the implied obligor probability of default are
banks' risk-weighted assets and total assets, which can be derived from the balance sheet data. We
59
Technically, what is obtained is the Value at Risk (VaR), or the loss which should not be exceeded under a certain
confidence level. The confidence is given by the probability of observing a realization of the risk factor which is more
extreme than the one corresponding to the reference scenario.
60
The Basel Committee permits banks a choice between two broad methodologies for calculating their capital requirements
for credit risk. One alternative, the Standardised Approach, measures credit risk in a standardised manner, supported by
external credit assessments. The alternative is the Internal Rating-Based (IRB) approach which allows institutions to use
their own internal rating-based measures for key drivers of credit risk as primary inputs to the capital calculation.
Institutions using the Foundation IRB (FIRB) approach are allowed to determine the borrowers’ probabilities of default
while those using the Advanced IRB (AIRB) approach are permitted to rely on own estimates of all risk components
related to their borrowers (e.g. loss given default and exposure at default). The Basel FIRB capital requirement formula
specified by the Basel Committee for credit risk is the Vasicek model for credit portfolio losses, default values for all
parameters except obligors’ probabilities of default are provided in the regulatory framework. On the Basel FIRB
approach, see Basel Committee on Banking Supervision, 2011.

65
present a brief overview of the main ingredients below. Benczur et al (2015)
61
offers some additional
details and discussion.
For each exposure l in the portfolio of bank i, the IRB formula derives the corresponding capital
requirement
needed to cover unexpected losses
62
over a time horizon of one year, with a specific
confidence level equal to 99.9% (see Figure A1.1):
,
where
is the default probability of exposure l, R is the correlation among the exposures in the
portfolio, defined as
with obligor size S =50.
Here LGD is the loss given default
63
and
is an adjustment term, defined as
with
and maturity M=2.5. Note that here all parameters are
set to their regulatory default values.
The minimum capital requirement of each bank i is obtained summing up the capital requirements for
all exposures:
,
where
is the amount of the exposure l.
As there are no available data on banks’ exposures towards each obligor, the model estimates the
default probability of a single obligor (implied obligor probability of default, IOPD) equivalent to the
portfolio of exposures held by each bank by inverting the above formulas. Mathematically speaking,
the model computes the IOPD by numerically solving the following equation:
,
where
and
are respectively the minimum capital requirement, set equal to 8% of the risk-
weighted assets, and the total assets of the bank. Note that capital and RWA are QIS-adjusted, as
detailed in Annex 6.2.
STEP 2: Simulation of correlated losses for the banks in the system.
Given the estimated IOPD, SYMBOL simulates correlated losses hitting banks via Monte Carlo, using
the same IRB formula and imposing a correlation structure among banks.
64
The correlation exists
61
http://ec.europa.eu/economy_finance/publications/economic_paper/2015/pdf/ecp548_en.pdf
62
Banks are expected to cover their expected losses on an ongoing basis, e.g. by provisions and write-offs. The unexpected
loss, on the contrary, relates to potentially large losses that occur rather seldom. According to this concept, capital would
only be needed for absorbing unexpected losses.
63
Set in Basel regulation equal to 45%.

66
either as a consequence of the banks’ exposure to common borrowers or, more generally, to a
particular common factor (for example, the business cycle). In each simulation run n=1,…,N
0
, losses
for bank i are simulated as:
,
where N is the normal distribution function, and
are correlated normal random shocks with
correlation matrix .
STEP 3: Determination of bank failure.
Given the matrix of correlated losses, SYMBOL determines which banks fail. As illustrated in Figure
A1.1, a bank failure happens when simulated obligor portfolio losses (L) exceed the sum of the
expected losses (EL) and the total actual capital (K) given by the sum of its minimum capital
requirements plus the bank’s excess capital, if any :
.
Figure A1.1 Individual bank loss probability density function
Notes. MCR: minimum capital requirements. VaR: value-at-risk.
The light grey area in Figure A1.1 represents the region where losses are covered by provisions and
total capital, while the dark grey one shows when banks fail under the above definition. It should be
noted that the probability density function of losses for an individual bank is skewed to the right, i.e.
there is a very small probability of extremely large losses and a high probability of losses that are
closer to the average/expected loss. The Basel Value at Risk (VaR) corresponds to a confidence level
of 0.1%, i.e. the minimum capital requirement covers losses from the obligors’ portfolio with
probability 99.9%. This percentile falls in the light grey area, as banks generally hold an excess capital
buffer on top of the minimum capital requirements. The actual level of capital hold by each bank i
determines the failure event.
64
The asset value of each bank’s debtors evolves according to
. Here Z
A,k
is
the idiosyncratic shock to the debtor, β
A
is the bank specific shock, while β is a common component. The parameter ρ
controls the degree of commonality in the shocks of two different banks.
67
STEP 4: Aggregate distribution of losses for the whole system.
Aggregate losses are obtained by summing losses in excess of capital of all distressed banks in the
system in each simulation run

68
6.4. Outputs on payout analysis via SYMBOL
Uncovered Liquidity Shortfall and Uncovered Losses under mandatory reinsurance and
mutualised fund (different parameters)
Beta = 75%, alpha = 20%, y = 20%

69
Beta = 75%, alpha = 20%, y = 80%

70
Beta = 75%, alpha = 80%, y = 20%
Beta = 75%, alpha = 80%, y = 80%

71
Beta = 75%, alpha = 100%, y = 100%

72
Beta = 50%, alpha = 20%, y = 20%

73
Beta = 50%, alpha = 20%, y = 80%

74
Beta = 50%, alpha = 80%, y = 20%

75
Beta = 50%, alpha = 80%, y = 80%

76
Beta = 50%, alpha = 100%, y = 100%
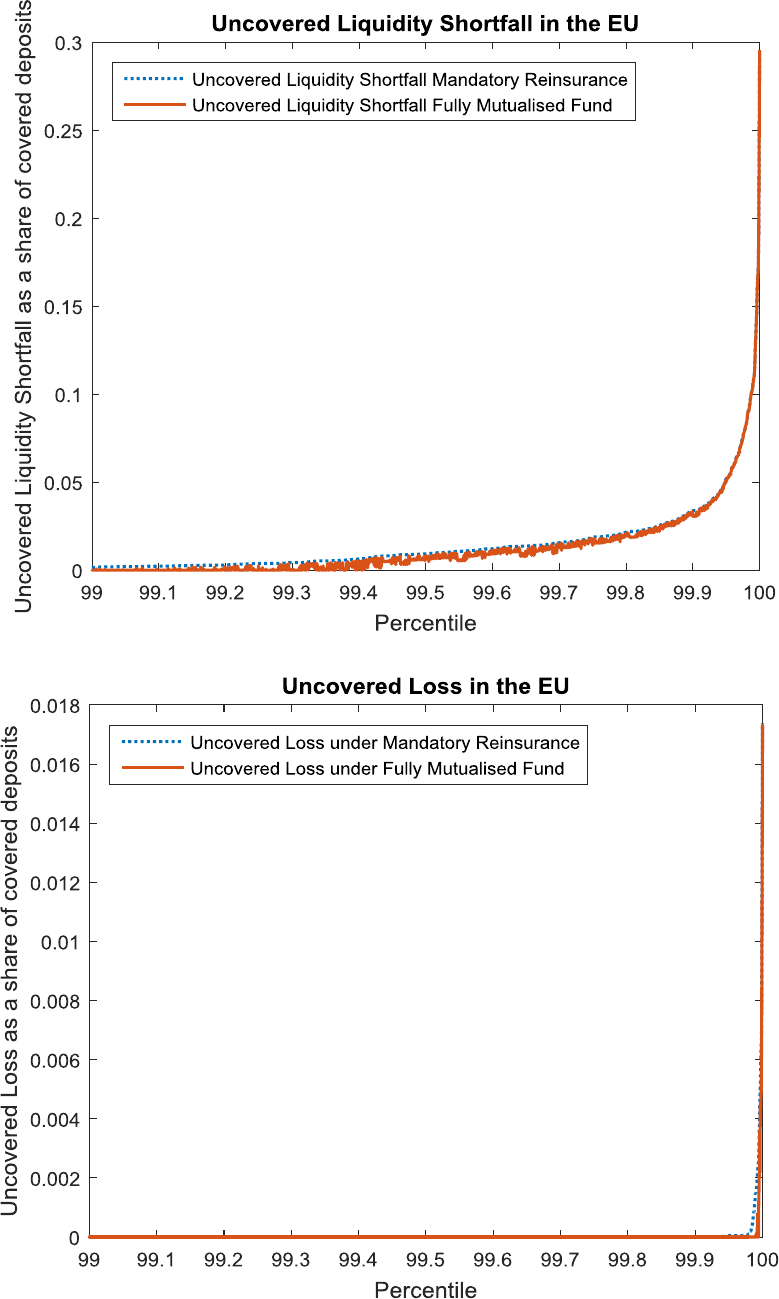
77
Beta = 25%, alpha = 20%, y = 20%

78
Beta = 25%, alpha = 20%, y = 80%

79
Beta = 25%, alpha = 80%, y = 20%

80
Beta = 25%, alpha = 80%, y = 80%

81
Beta = 25%, alpha = 100%, y = 100%

82

83
6.5. Outputs on the effectiveness of a fully-mutualised EDIS relative to national-level DGS, via
SYMBOL
Introduction
The Commission has argued that EDIS is needed because national DGS could be vulnerable to large
local shocks.
65
Compared to the current set-up of national DGS, EDIS would enhance the level of
protection for depositors. The Commission's main hypothesis is that by pooling resources in a single
insurance fund, EDIS could cope with larger pay-out events and may thus increase the level of
depositor confidence. The analysis presented in this Annex uses data on insured bank deposits in all
MS and assesses how the DGS' payout capacity would change by moving from the current system to
EDIS. The purpose of this analysis is to test whether the Commission's reasoning for proposing EDIS
can be supported by data.
Overview of insured deposits and national DGS in place in the EU
Table 25 indicates the amount of total deposits and covered deposits for all Member States in 2013 and
2014. Most data has been directly provided by DGS, which participated in a survey conducted by the
Commission's Joint Research Centre (JRC). Where unavailable, deposits have been estimated using
data from the ECB and Eurostat. These data are relevant as the DGS Directive 2014 requires 'covered
deposits' to be covered by national schemes (up to 0.8%) by 2024.
Table 25: Total amount of total and estimated covered deposits
2013
2014
Total deposits 000 €
Covered deposits 000 €
Total deposits 000€
Covered deposits 000 €
EU
14,545,767,827
6,922,442,436
15,064,079,488
7,284,486,567
Definitions:
DEPOSIT: Any deposit as defined in Article 1(1) of Directive 94/19/EC
66
, excluding those deposits
left out from any repayment by virtue of Article 2
67
.
LEVEL OF COVERAGE: Level of protection granted in the event of deposits being unavailable under
your national law.
ELIGIBLE DEPOSITS (or PROTECTED or INSURED): Deposits repayable by the guarantee scheme
under your national law, before the level of coverage is applied.
COVERED DEPOSITS (or GUARANTEED or REIMBURSABLE or REPAYABLE): Deposits
obtained from eligible deposits when applying the level of coverage provided for in your national
legislation.
There are 38 DGS in the EU (end 2014). Most are ex ante funded via annual contributions paid by
banks, while 11 in 6 countries are ex-post funded. As of 2015, all of these DGS are required to build
up financial means using ex-ante contributions. The currently available financial means reported by
DGSs differ. In some cases, the available means are reported as zero, either because the reporting DGS
65
See http://europa.eu/rapid/press-release_MEMO-15-6153_en.htm?locale=en
66
“Deposit” shall mean any credit balance which results from funds left in an account or from temporary situations deriving
from normal banking transactions and which a credit institution must repay under the legal and contractual conditions
applicable, and any debt evidenced by a certificate issued by a credit institution.
67
The following shall be excluded from any repayment by guarantee schemes:
a) subject to Article 8 (3), deposits made by other credit institutions on their own behalf and for their own account,
b) all instruments which would fall within the definition of 'own funds' in Article 2 of Council Directive 89/299/EEC
of 17 April 1989 on the own funds of credit institutions,
c) deposits arising out of transactions in connection with which there has been a criminal conviction for money
laundering as defined in Article 1 of Council Directive 91/308/EEC of 10 June 1991 on prevention of the use of the
financial system for the purpose of money laundering.

84
has so far only collected ex-post contributions or because no data were available for the observation
period. Any reported data on available means are confidential and so cannot be presented in this
working document. However, it can be indicated that the size of DGS funds reaches an average value
of 1% and a median of 0.7% of covered deposits.
Two implications can be drawn from the available data on the financial means of national DGS:
First, in order to be effective, EDIS will need to provide liquidity support in its initial phase.
Otherwise, national DGS will still depend almost entirely on national alternative funding
means in the event of large local shocks.
Second, in the interest of fairness, EDIS must be designed in a way that avoids
disproportionate advantages for national-level schemes, which have not yet started collecting
ex-ante contributions. Also, any disincentives to collect such contributions in the future must
be avoided. At the same time, DGSs which have collected funds, over and above the 0.8% of
covered deposits required by the DGS Directive should not face a disadvantage from being
fully compliant or "over-compliant" with the Directive.
These considerations are mirrored in the re-insurance approach, under which EDIS works primarily as
a liquidity backstop in case national funds are not sufficient to cover pay-out events. In addition, EDIS
sets out a mandatory funding path to ensure funds are built-up at the same pace everywhere.
Capacity for pay-outs: national DGS versus EDIS
This section analyses the effectiveness of a fully-mutualised EDIS relative to national-level DGS in
the event of simulated pay-out events. The analysis begins by comparing the target funding levels (i.e.
0.8% of covered deposits) of national-level DGS and EDIS with the amount of covered deposits held
by individual banks in the Banking Union so as to understand their respective capacity to cope with
any pay-out. The analysis continues by simulating potential pay-out events affecting the national-level
DGS and assessing the average size of the simulated pay-outs which would exceed the available funds
in a national DGS.
The simulations presented in this section are based on the same sample presented in Annex 6.2. The
following analysis makes a distinction between significant and non-significant banks. Significant
banks in the Banking Union are entities belonging to groups falling under SSM supervision. They are
thus selected on the basis of the list of significant banks published by the SSM.
Significant banks headquartered outside of the Banking Union meet similar criteria as set by
the ECB (Article 6(4) of SSM Regulation). As the Commission services do not have data on
cross border activities and there is no available information on whether a bank has fulfilled the
direct public finance assistance criterion, only the other criteria have been applied at the
highest group level of consolidation, i.e. size criterion: total assets (TA) > 30billion €;
economic importance criterion: total assets > 20% GDP and total assets >5 billion €; top three:
three largest banks in a Member State (MS) in terms of total assets.
The remaining banks are assumed to be non-significant and so enter insolvency and trigger
DGS intervention in case of distress.
On the basis of the above categorisations, Table 26 indicates for each Member State the number of
banks in the sample (column 2), the number of 'significant' banks (column 3), and the number of 'non-
significant' banks (column 4). It should be noted that the results presented in the next sections should
be interpreted with some caution when the number of banks in a country (or in sub-samples) is lower
than 10. The same remark applies, albeit to a lesser extent, whenever the number of banks is slightly
higher (10 to 15). This does not affect simulation results at aggregated level (like in Figure 14).

85
Table 26: Categorisation of selected banks by Member State in sample
Number of
banks
Number of
significant banks
Number of non-
significant banks
AT
169
84
85
BE
34
15
19
BG
17
9
8
CY
9
5
4
CZ
24
14
10
DE
1586
54
1532
DK
82
11
71
EE
3
1
2
ES
84
34
50
FI
29
6
23
FR
252
180
72
GR
7
4
3
HR
28
10
18
HU
17
3
14
IE
15
11
4
IT
540
72
468
LT
8
3
5
LU
44
27
17
LV
13
2
11
MT
9
3
6
NL
31
11
20
PL
33
18
15
PT
22
11
11
RO
18
10
8
SE
75
14
61
SI
19
9
10
SK
11
5
6
UK
180
50
130
EU
3,359
676
2,683
Source: JRC elaborations, ECB
Capacity to meet a single pay-out
In this section, the capacity of national-level DGS funds to absorb pay-outs for a single bank failure is
assessed relative to that of EDIS. For each Member State, the estimated amount of covered deposits
held by each bank is compared to the target funding level of the national-level DGS and the target
funding level of a fully-mutualised EDIS. Table 26 presents selected statistics for all EU Member
States. The table indicates the corresponding shares of those banks in the sample of banks (columns A
and B); the corresponding shares of those banks in terms of assets (columns C and D); the
corresponding share of those banks in terms of covered deposits (columns E and F) and the increase in
the amount of covered deposits when moving from the national DGS to EDIS as a share of the
Member State’s GDP, Banking Union and EU GDP (columns G, H and I). Values are expressed as
averages and percentiles of the distribution across all Member States.
The conclusion from Table 26 is clear. EDIS is considerably less likely to fall short of pay outs
than a national DGS.
The reasons are twofold: (a) an individual bank is relatively smaller at the European level than at
national level; and (b) the absolute amount of the EDIS target funding level is significantly larger than
any of the individual national DGS. In terms of GDP per Member State, the average increase in
covered deposits reimbursed by the EDIS is around 28% while the median is roughly 27% of the GDP.

86 EN
Table 27: Capacity to absorb single bank pay-outs: national DGS versus EDIS
A
B
C
D
E
F
G
H
I
Share of
banks
below the
national
DGS
target
Share of
banks
below
the EDIS
target
Share of
total assets
of banks
below the
national
DGS target
Share of
total assets
of banks
below the
EDIS
target
Share of
covered
deposits of
banks
below the
national
DGS
Share of
covered
deposits of
banks below
the single DGS
(if applicable)
Increased
amount of
covered
deposits when
moving to
EDIS
Share of MS
GDP
Increased
amount of
covered
deposits when
moving to
EDIS
Share of Euro
area GDP
Increased
amount of
covered
deposits when
moving to
EDIS
Share of EU28
GDP
Ave-
rage
48.3%
98.8%
13.5%
83.3%
7.9%
82.9%
28.6%
0.719%
0.530%
Q1
12.2%
99.4%
0.7%
62.3%
0.8%
63.1%
26.7%
0.548%
0.093%
Q2
46.3%
100.0%
6.4%
100.0%
3.1%
100.0%
15.6%
0.126%
0.404%
Q3
82.0%
100.0%
28.0%
100.0%
6.8%
100.0%
44.8%
1.012%
0.747%

Commission européenne/Europese Commissie, 1049 Bruxelles/Brussel, BELGIQUE/BELGIË - Tel. +32 22991111
Capacity to meet multiple pay-outs
As a second step in the analysis, the capacity of national-level DGS and EDIS – again at target
funding levels – to cover multiple successive pay-outs can be analysed. Results in this section are
based on the simulation of multiple DGS pay-outs using the SYMBOL model and applying the
approach developed by Cariboni et al (2015).
68
In the analysis, the aggregated pay-out not covered (i.e.
shortfall) by each national DGS is calculated for each bank in the Banking Union, when each national
DGS is assumed to reimburse the shortfalls of the banks in its own country. This aggregated variable
is then compared with the corresponding shortfall in the case of a fully-mutualised EDIS. The
difference between the two estimated shortfalls provides an insight into the increased loss-absorption
capacity implied by EDIS.
Figure 14 shows the distribution of the aggregated shortfall by the national DGS (blue line) and the
corresponding shortfall for EDIS (orange line). It can be noted that the shortfall under a fully
integrated EDIS is always smaller than the shortfall under a national-level DGS system and one can
also observe, on the left part of the figure, a large number of cases where EDIS can fully absorb pay-
outs where the national DGS cannot. These results demonstrate that, in all the cases where national-
level DGS cannot fully cover simulated pay-outs, EDIS can further absorb 80% of the pay-outs on
average. The results also show that, while national DGS cannot fully cover pay-outs in 2.5% of the
cases, this share decreases to 0.7% when EDIS is in place.
Figure 14: Amount of uncovered payouts when national DGS are in place and only EDIS is in place
The conclusion of this analysis is again clear.
A system with joint financial means and joint liability, such as EDIS, would operate more efficiently,
i.e. providing a higher level of protection than that based on national Deposit Guarantee Schemes.
68
See Cariboni J., Di Girolamo F., Maccaferri S., Petracco Giudici M. (2015): Assessing the potential reduction of DGS
funds according to Article 10(6) of Directive 2014/49/EU: a simulation approach based on the Commission SYMBOL
model, JRC Technical report JRC95181 (forthcoming). Note that in th paper simulations are run country by country
independently. For this analysis, losses are firstly simulated jointly for all EU 28 banks and then distributed losses across
country.

88
Conclusion
The short stylised analysis presented in this Annex demonstrates that EDIS will improve deposit
insurance cover for banks in all participating Member States, without changing the overall level of
funding. This is achieved by pooling the ex-ante contributions in one fund that could absorb larger
shocks than any of the national DGS could.

89
6.6. Outputs on payout analysis on the transitional period via SYMBOL
The phase-in procedure where EDIS will gradually complement existing national schemes is expected
to last 7 years and it is divided into two phases, namely reinsurance and co-insurance. Over the whole
transition period, the AFM at the disposal of a given national DGS are a share of the target fund
collected up to time t, while the complementary share is transferred to the EDIS. Technically:
where and target(t) are defined according to Figure 15 ( corresponds to the light blue part
and target(t) is the overall height of the bars).
Figure 15: Evolution of EDIS funds compared to the funds of a participating DGS
Source: DG FISMA, http://ec.europa.eu/finance/general-policy/docs/banking-union/european-deposit-insurance-
scheme/151124-graph_en.pdf
Reinsurance phase
During this phase, the first function of the European reinsurance scheme is to cover a share
of the
amount which remains uncovered by the national DGS (liquidity shortfall). In formulas (for simplicity
we suppress the reference to the time t):
In other words, the national DGS, using its AFM and raising short-term extraordinary contributions
(SC), is called upon to reimburse the covered deposits of the distressed banks. What is left is partially
transferred to the EDIS, which uses the funds at its disposal to cover such shortfall.
The remaining part, i.e. the amount of deposits that neither the national DGS nor EDIS is able to
cover, is called uncovered liquidity shortfall.
Failing banks enter an insolvency procedure, which lasts much longer than the few days in which
liquidity needs to be provided to reimburse covered deposits. During this phase, national DGSs and
the EDIS are treated as senior creditors and may recover an amount R. Moreover, the DGS can call

90
long-term extraordinary contributions (LEC). R and LEC can be used to cover the liquidity shortfall.
The amount of deposits that remains uncovered after recovery and LEC is called excess loss:
The second function of the European reinsurance scheme is to cover a share
of the excess loss:
Over time the reinsurance scheme would have constant coverage, i.e.
is time-independent.
Both the short-term funding provided by EDIS (
) and the amount of losses
which is in the end borne by EDIS (
) are capped according to the following
formulas:
where C is the country where the shortfall occurs and t=1,2,3 (t=1 corresponding to 2017 and t=3
corresponding to 2020).
Co-insurance phase
In the co-insurance regime, the EDIS contributes a share
to each pay-out starting from the first
Euro. This share increases over time (e.g., linearly rising from 20% to 100% over five years). At the
same time, AFM of the national DGS shrink over time, as funds are increasingly transferred to the
EDIS (see Figure 15).
The excess loss remaining once the insolvency procedure is over and long-term ex-post contributions
have been called is computed as follows:
.
Sample description
The results presented in Section 4.1.2 are based on end-of-year unconsolidated banks’ balance sheet
data gathered through Bankscope. The dataset covers a sample of around 2,900 Euro Area banks as of
2013. Missing values are imputed through robust statistics (see Cannas et al. (2013)). Table 28 shows
aggregated values for some selected variables.

91
Table 28. Sample banks dataset (data from 2013)
Number of
banks
Total assets
bn€
RWA bn€
Covered
deposits bn€
Capital bn€
2,885
25,267
9,505
4,774
1,627
Data are corrected to reflect the Basel III definitions of capital and risk weighted assets, as described
in Annex 6.2
The key input data necessary to run SYMBOL are the following:
Total assets;
Risk-weighted assets;
Total capital and/or capital ratios.
Covered deposits.
The amount of covered deposits by bank is not available in Bankscope, hence we derive it for each
bank based on statistics at the country level and bank-level data on customer deposits. In particular, we
estimate the amount of covered deposits for each bank by applying the ratio of covered deposits over
customer deposits at the country level to the customer deposits held by each bank.

92
6.7. List of European banking groups in the CDS premia analysis
Bank
Country
1
HSBC
United Kingdom
2
Barclays
United Kingdom
3
Lloyds Bank
United Kingdom
4
Nomura Europe Holdings
United Kingdom
5
RBS
United Kingdom
6
Standard Chartered Bank
United Kingdom
7
Credit Agricole
France
8
BNP Paribas
France
9
Societe Generale
France
10
Credit Mutuel (BFCM)
France
11
Group BPCE
France
12
Deutsche Bank
Germany
13
Commerzbank
Germany
14
Deutsche Zentral-Genossenschaftsbank AG
Germany
15
Volksbanken Raiffeisenbanken Genossenschaftlichen FinanzGruppe
Germany
16
Banco Santander
Spain
17
BBVA
Spain
18
ING Group
The Netherlands
19
Rabobank
The Netherlands
20
ABN AMRO
The Netherlands
21
Intesa Sanpaolo
Italy
22
Unicredit
Italy
23
Nordea Bank
Sweden
24
Svenska Handlesbanken
Sweden
25
Swedbank AB
Sweden
26
Erste Group
Austria
27
Raiffeisen Zentralbank
Austria
28
KBC Bank
Belgium
29
Dexia Group
Belgium
30
National Bank of Greece
Greece
31
Piraeus Bank
Greece
32
Allied Irish Banks
Ireland
33
Governor and Company of the Bank of Ireland
Ireland
34
BCPN (Banco Comercial Portugal)
Portugal
35
Caixa Geral de Depositos SA
Portugal

93
6.8. Outputs of the CDS spread analysis
Summary Table #1
Output #1
Output #2
NonDomesti~e 66,500 256.7795 132.5271 81.36143 682.1877
DomesticBa~e 64,886 242.3198 347.1989 38.85499 6534.469
BankAverage 66,500 250.8894 126.9252 88.84676 626.7734
CDSpremium 66,534 229.8621 348.9482 0 6534.469
BankCode 66,535 18 10.09958 1 35
Variable Obs Mean Std. Dev. Min Max
rho .5792612 (fraction of variance due to u_i)
sigma_e 221.54388
sigma_u 259.95052
_cons 28.53223 41.77907 0.68 0.499 -56.37306 113.4375
BankAverage .8026042 .1665239 4.82 0.000 .464187 1.141021
CDSpremium Coef. Std. Err. t P>|t| [95% Conf. Interval]
Robust
(Std. Err. adjusted for 35 clusters in BankCode)
corr(u_i, Xb) = -0.0629 Prob > F = 0.0000
F(1,34) = 23.23
overall = 0.0604 max = 1,900
between = 0.9999 avg = 1,900.0
within = 0.1740 min = 1,900
R-sq: Obs per group:
Group variable: BankCode Number of groups = 35
Fixed-effects (within) regression Number of obs = 66,500
rho .36872382 (fraction of variance due to u_i)
sigma_e 171.26443
sigma_u 130.89048
_cons 6.856372 24.15018 0.28 0.778 -42.22271 55.93545
NonDomesticBankAverage .3432003 .1546824 2.22 0.033 .0288479 .6575528
DomesticBankAverage .5327105 .1417473 3.76 0.001 .2446452 .8207758
CDSpremium Coef. Std. Err. t P>|t| [95% Conf. Interval]
Robust
(Std. Err. adjusted for 35 clusters in BankCode)
corr(u_i, Xb) = 0.4217 Prob > F = 0.0000
F(2,34) = 44.25
overall = 0.5985 max = 1,900
between = 0.8312 avg = 1,853.0
within = 0.4384 min = 484
R-sq: Obs per group:
Group variable: BankCode Number of groups = 35
Fixed-effects (within) regression Number of obs = 64,854

94
Summary Table #2
Output #3
Output #4
NonDomesti~e 8,855 175.0867 45.62863 84.89515 313.9856
DomesticBa~e 8,855 170.3913 287.9789 42.38449 4847.172
BankAverage 8,855 170.3913 40.92713 93.91058 279.9075
CDSpremium 8,855 170.3913 289.2568 37.79999 4847.172
BankCode 8,855 18 10.10008 1 35
Variable Obs Mean Std. Dev. Min Max
rho .77537128 (fraction of variance due to u_i)
sigma_e 140.15054
sigma_u 260.38562
_cons 59.37914 35.89126 1.65 0.107 -13.56068 132.319
BankAverage .6515131 .2106402 3.09 0.004 .2234407 1.079586
CDSpremium Coef. Std. Err. t P>|t| [95% Conf. Interval]
Robust
(Std. Err. adjusted for 35 clusters in BankCode)
corr(u_i, Xb) = -0.1810 Prob > F = 0.0039
F(1,34) = 9.57
overall = 0.0047 max = 253
between = 1.0000 avg = 253.0
within = 0.0340 min = 253
R-sq: Obs per group:
Group variable: BankCode Number of groups = 35
Fixed-effects (within) regression Number of obs = 8,855
rho .63938442 (fraction of variance due to u_i)
sigma_e 132.4379
sigma_u 176.34821
_cons 54.58898 18.31977 2.98 0.005 17.35873 91.81924
NonDomesticBankAverage .325074 .122466 2.65 0.012 .0761931 .5739548
DomesticBankAverage .3455941 .0385221 8.97 0.000 .2673077 .4238804
CDSpremium Coef. Std. Err. t P>|t| [95% Conf. Interval]
Robust
(Std. Err. adjusted for 35 clusters in BankCode)
corr(u_i, Xb) = 0.7905 Prob > F = 0.0000
F(2,34) = 89.51
overall = 0.6558 max = 253
between = 0.9470 avg = 253.0
within = 0.1375 min = 253
R-sq: Obs per group:
Group variable: BankCode Number of groups = 35
Fixed-effects (within) regression Number of obs = 8,855
