
Participant-Based Survey Sampling Guide for
Feed the Future Annual Monitoring Indicators
Diana Maria Stukel, PhD
September 2018

FANTA
I
I
I
FOOD AND NUTRITION
TECHNICAL A SSISTANCE
This guide is made possible by the generous support of the American people
through the support of the Oce of Maternal and Child Health and Nutrion,
Bureau for Global Health, U.S. Agency for Internaonal Development (USAID),
USAID Bureau for Food Security and USAID Oce of Food for Peace, under
terms of Cooperave Agreement No. AID-OAA-A-12-00005, through the Food
and Nutrion Technical Assistance III Project (FANTA), managed by FHI 360.
The contents are the responsibility of FHI 360 and do not necessarily reect the
views of USAID or the United States Government.
September 2018
Recommended Citation
Stukel, Diana Maria. 2018. Participant-Based Survey Sampling Guide for Feed
the Future Annual Monitoring Indicators. Washington, DC: Food and Nutrition
Technical Assistance Project, FHI 360.
The citaon for the original edion of this guide is: Stukel, Diana Maria and
Friedman, Gregg. 2016. Sampling Guide for Beneciary-Based Surveys for Select
Feed the Future Agricultural Annual Monitoring Indicators. Washington, DC:
Food and Nutrion Technical Assistance Project, FHI 360.
Contact Informaon
Food and Nutrion Technical Assistance III Project (FANTA)
FHI 360
1825 Conneccut Avenue, NW
Washington, DC 20009-5721
www.fantaproject.org
Cover photo credit: Nishanth Dangra, courtesy of Photoshare
Participant-Based Survey Sampling Guide for Feed the Future Annual Monitoring Indicators i
Acknowledgments
The author would like to thank Anne Swindale and Arif Rashid for their invaluable comments,
suggestions, and insights on an earlier draft of this second edition of the guide. I am also indebted to Jeff
Feldmesser for his careful editing of the manuscripts and to the FANTA Communications Team for
transforming the guide into a final professional product.
Participant-Based Survey Sampling Guide for Feed the Future Annual Monitoring Indicators ii
Contents
Acknowledgments ................................................................................................................................ i
Abbreviations and Acronyms ............................................................................................................... v
PART 1
1. Purpose and Background ............................................................................................................... 2
1.1 Purpose of the Sampling Guide on Participant-Based Surveys ...................................................... 2
1.2 Background ..................................................................................................................................... 3
2. The Four Selected Feed the Future Agriculture-Related Annual Monitoring Indicators ................... 6
2.1 The “Yield of Agricultural Commodities” Indicator ........................................................................ 8
2.2 The “Number of Hectares under Improved Management Practices” Indicator ............................ 9
2.3 The “Value of Sales” and “Number of Individuals Using Improved Management Practices”
Indicators ........................................................................................................................................ 9
PART 2
3. Comparison of Routine Monitoring and Participant-Based Surveys .............................................. 11
3.1 Overview ...................................................................................................................................... 11
3.2 Description and Features of the Approaches ............................................................................... 11
3.2.1 Routine Monitoring........................................................................................................... 11
3.2.2 Participant-Based Surveys ................................................................................................ 12
3.3 Advantages of Each Approach ...................................................................................................... 12
3.3.1 Advantages of Routine Monitoring ................................................................................... 12
3.3.2 Advantages of Participant-Based Surveys ........................................................................ 13
4. When Are Participant-Based Surveys Appropriate? ...................................................................... 14
4.1 Scenario #1: Large Project Size/Inadequate Number of Data Collection Staff ............................ 14
4.2 Scenario #2: Farmer Estimates of Area Considered Unreliable and Direct Measurement
of Plots Preferred ......................................................................................................................... 15
4.3 Scenario #3: Lack of Direct Contact between a Project and Its Participants ............................... 15
PART 3
5. Timing and Frequency of Participant-Based Survey Data Collection ............................................. 17
6. Issues to Consider When Outsourcing Work to an External Contractor ......................................... 19
6.1 Time and Effort Required to Procure and Manage an External Contractor ................................. 20
6.2 Importance of a Good Scope of Work to Guide the Process ....................................................... 20
6.3 Judging the Expertise of Potential External Contractors.............................................................. 21
Participant-Based Survey Sampling Guide for Feed the Future Annual Monitoring Indicators iii
PART 4
7. Sampling Frame Guidance for Participant-Based Surveys ............................................................. 23
7.1 Information to Include on a Sampling Frame .............................................................................. 23
7.2 Participant Registration Systems as a Source of Establishing Sampling Frames .......................... 25
7.3 Frames for Multiple Participant-Based Surveys Conducted in the Same Year ............................ 26
8. Overview of Various Approaches for Collecting Annual Monitoring Data Using Participant-
Based Surveys .............................................................................................................................. 27
8.1 Approach 1: Household Survey Approach ................................................................................... 27
8.2 Approach 2: Producer Groups Approach ..................................................................................... 28
8.3 How to Choose the Right Approach ............................................................................................. 29
8.4 Details on the Two Approaches ................................................................................................... 29
PART 5
9. The Household Survey Approach (Approach 1) ............................................................................ 32
9.1 Choosing a Survey Design Option ................................................................................................ 32
9.1.1 Survey Design Option 1: Two-Stage Cluster Design with Systematic Selection of
Participants ....................................................................................................................... 32
9.1.2 Survey Design Option 2: Two-Stage Cluster Design with a Listing Operation and
Systematic Selection of Participants ................................................................................. 33
9.1.3 Survey Design Option 3: One-Stage Design with Systematic Selection of Participants ... 34
9.1.4 Summary of the Recommended Survey Design Options under the Household Survey
Approach ........................................................................................................................... 35
9.1.5 A Cautionary Note on the Use of Lot Quality Assurance Sampling .................................. 35
9.2 Calculating the Sample Size for All Survey Design Options of the Household Survey
Approach ...................................................................................................................................... 36
9.2.1 Types of Surveys and Indicators ....................................................................................... 37
9.2.2 Calculating the Sample Size .............................................................................................. 38
9.2.3 Adjustments to the Sample Size Calculation .................................................................... 44
9.2.4 Final Sample Size ............................................................................................................... 46
9.2.5 Determining the Overall Sample Size for the Survey ........................................................ 49
9.2.6 Updating Elements of the Sample Size Formula in Future Survey Rounds ...................... 53
9.3 Choosing the Number of Clusters to Select for Survey Design Options 1 and 2 of the
Household Survey Approach ........................................................................................................ 54
9.4 Selecting a Sample of Clusters for Survey Design Options 1 and 2 for the Household Survey
Approach ...................................................................................................................................... 57
9.4.1 Systematic PPS Sampling .................................................................................................. 57
9.4
.2 Fractional Interval Systematic Sampling ........................................................................... 63
9.5 Selecting the Survey Respondents for All Survey Design Options for the Household Survey
Approach ...................................................................................................................................... 67
9.5.1 Selecting Survey Respondents before Fieldwork Using Fractional Interval Systematic
Sampling (for Survey Design Options 1 and 3) ................................................................. 67
9.5.2 Listing Operation in the Field (for Survey Design Option 2) ............................................. 70
Participant-Based Survey Sampling Guide for Feed the Future Annual Monitoring Indicators iv
9.5.3 Selecting Survey Respondents in the Field Using Systematic Sampling (for
Survey Design Option 2) ................................................................................................... 71
9.5.4 Considerations to Take into Account When Selecting the Survey Respondent ............... 73
10. The Producer Groups Approach (Approach 2) .............................................................................. 75
10.1 Choose a Survey Design Option ................................................................................................... 75
10.2 Calculate the Sample Size ............................................................................................................. 75
10.3 Choose the Number of Producer Groups to Select ...................................................................... 76
10.4 Select a Sample of Producer Groups ............................................................................................ 76
10.5 Select All Participants within Sampled Producer Groups ............................................................. 76
PART 6
11. Sample Weighting ........................................................................................................................ 79
11.1 Calculating Sample Weights to Reflect Probabilities of Selection ............................................... 79
11.1.1 Overview of How to Calculate Sample Weights to Account for Probabilities of
Selection ........................................................................................................................... 80
11.1.2 Calculating the Probability of Selection at the First Stage ................................................ 81
11.1.3 Calculating the Probability of Selection at the Second Stage ........................................... 83
11.1.4 Calculating the Overall Probability of Selection ............................................................... 85
11.1.5 Calculating the Sampling Weights to Account for Probabilities of Selection ................... 87
11.2 Adjusting Survey Weights for Non-Response .............................................................................. 88
11.3 Calculating the Final Sampling Weights ....................................................................................... 89
12. Producing Estimates of Indicators of Totals .................................................................................. 91
12.1 Producing Estimates for the Four Indicators ................................................................................ 92
12.2 Comparing Indicator Values of Totals over Time ......................................................................... 92
13. Producing Confidence Intervals and Standard Errors Associated with the Indicators of Totals ...... 93
13.1 Calculating Confidence Intervals and Standard Errors Associated with Estimates of Totals ....... 94
13.2 Interpreting Confidence Intervals ................................................................................................ 95
13.3 An Example of Calculating a Confidence Interval and a Standard Error for an Estimate of
a Total ........................................................................................................................................... 95
13.4 Calculating Confidence Intervals and Standard Errors for the “Yield of Agricultural
Commodities” Indicator ............................................................................................................... 96
ANNEXES
Annex 1. Scope of Work Template for Participant-Based Survey .............................................................. 98
Annex 2. Illustrative Job Descriptions for Key Survey Team Members .................................................... 108
Annex 3. C
hecklist for Engaging External Contractors ............................................................................. 110
Annex 4. Participant-Based Surveys for Non-Agricultural Annual Monitoring Indicators ....................... 111
Annex 5. Computing Estimates of the “Percentage of Female Participants of USG Nutrition-Sensitive
Agriculture Activities Consuming a Diet of Minimum Diversity” Indicator .............................................. 119
Participant-Based Survey Sampling Guide for Feed the Future Annual Monitoring Indicators v
Abbreviations and Acronyms
BFS Bureau for Food Security (USAID)
DHS Demographic and Health Surveys
EA enumeration area
FANTA Food and Nutrition Technical Assistance Project
FFP Office of Food for Peace (USAID)
FFPMIS Food for Peace Management Information System
FFS farmer field school
FTFMS Feed the Future Monitoring System
GFSS Global Food Security Strategy
GPS global positioning system
IFPRI International Food Policy Research Institute
IM implementing mechanism
IP implementing partner
IPTT indicator performance tracking table
LQAS Lot Quality Assurance Sampling
LSMS Living Standards Measurement Studies
M&E monitoring and evaluation
MCHN maternal and child health and nutrition
MICS Multiple Indicator Cluster Surveys
MOE margin of error
PaBS participant-based survey
PBS population-based survey
PDA personal digital assistant
PG producer group
PIRS Performance Indicator Reference Sheet
PPS probability-proportional-to-size
SOW scope of work
SRS simple random sampling
USAID U.S. Agency for International Development
USG U.S. Government
WASH water, sanitation, and hygiene
WDDS Women’s Dietary Diversity Score

Participant-Based Survey Sampling Guide for Feed the Future Annual Monitoring Indicators 1
INTRODUCTION
CHAPTERS
1. Purpose and Background ..................................................................................... 2
2. The Four Selected Feed the Future Agriculture-Related Annual Monitoring
Indicators .............................................................................................................. 6

Participant-Based Survey Sampling Guide for Feed the Future Annual Monitoring Indicators 2
1. Purpose and Background
1.1 Purpose of the Sampling Guide on Participant-Based Surveys
This guide provides technical guidance on the design and use of participant-based surveys
1
(PaBSs) to
support the collection of data for annual monitoring indicators. The guide is intended for use mainly by
U.S. Agency for International Development (USAID) Feed the Future implementing partners (IPs),
including USAID Office of Food for Peace (FFP) development food security activity awardees.
PaBSs are conducted among a sample of the population that participates in a project’s interventions.
2
This is in contrast to population-based surveys (PBSs), which are conducted among a sample of the
entire population living within a project’s area of coverage. Typically, PBSs are used in the Feed the
Future context for performance evaluations using baseline, interim, and end-line surveys, and to
monitor progress and see if there has been change over time at the population level in key outcomes
and impact indicators. In contrast, PaBSs are typically used in the context of project monitoring to
ensure that project implementation is rolling out as expected and that project interventions are on track
for achieving their intended outcomes and targets in the participant population. The results of such
monitoring exercises can be used to inform decisions about project strategies and to make corrections
to project components if monitoring data show that they are not on track.
Data in support of annual monitoring indicators can be collected either through a project’s routine
monitoring systems or through specialized periodic PaBSs. All Feed the Future IPs have routine
monitoring systems in place to collect basic process, output, and outcome data relating to their projects,
to support the tabulation of output
3
and outcome
4
indicators on (ideally) all participants of the
1
Such surveys were formerly called “beneficiary-based surveys.” According to the Feed the Future Indicator Handbook, “We
changed from using the term project ‘direct beneficiaries’ to using the term project ‘participants’ to describe the universe
captured by [implementing mechanism]-level indicators to better align with market system-based approaches. The revised
terminology also more clearly communicates that those with whom we work are active participants in their country’s
development journey, to their own and others’ benefit.”
2
This guide uses the term “project” to refer to FFP-funded development food security activities and to non-FFP-funded
activities under broader Feed the Future projects. See the USAID Automated Directives System glossary for the definitions of
project and activity (https://www.usaid.gov/sites/default/files/documents/1868/ADS_glossary.pdf).
3
Output indicators are those that reflect direct products of the activity (e.g., number of trainees, number of meetings held)
that result from the combination of inputs and processes. Inputs are the sets of resources (e.g., staff, financial resources, space,
project participants) brought together to accomplish the project’s objectives. Processes are the sets of activities (e.g., training,
delivering services) by which resources are used in pursuit of the desired results.
4
Outcome indicators are those that reflect the set of participant-level results (such as changes in practices, skills, or knowledge)
that are expected to change from the activity’s interventions. Note that, for example, lower-level outcomes might reflect
changes in knowledge, whereas higher-level outcomes might reflect changes in practices.

Participant-Based Survey Sampling Guide for Feed the Future Annual Monitoring Indicators 3
projects.
5
Often data collection through routine monitoring occurs simultaneously with project
implementation; such data are collected by community members, government workers, and/or project
monitoring and evaluation (M&E) staff.
Because of the complexities involved in conducting PaBSs, Feed the Future IPs should, when possible,
collect data in support of annual monitoring indicators through routine monitoring systems.
Nevertheless, there are various scenarios (discussed in detail in Chapter 4 of this guide) that may
necessitate conducting periodic PaBSs to collect these data. This guide aims to provide a technical
roadmap for IPs wanting to design and plan for PaBSs to collect data in support of annual monitoring
indicators under such scenarios. The guide predominantly focuses on four Feed the Future agriculture
indicators that are considered more challenging in terms of the associated data collection; Indicators
relating to other sectors are discussed in Annex 4.
1.2 Background
Feed the Future, a U.S. Government (USG) initiative led by USAID, is the USG’s global hunger and food
security initiative. Phase one of the initiative was launched in 2010. Phase two, which was launched in
2017, is guided by the USG Global Food Security Strategy (GFSS) 2017–2021,
6
which presents an
integrated, whole-of-government strategy and agency-specific implementation plan, as required by the
Global Food Security Act of 2016. Feed the Future phase one indicators were revised in phase two; these
included the set of implementing mechanism (IM) indicators (a subset of all Feed the Future indicators)
used for annual monitoring purposes. Each IM indicator has an associated Performance Indicator
Reference Sheet (PIRS) that provides the information needed to gather data and report on the
indicator.
7
FFP, which is part of Feed the Future,
8
has adopted many of these IM indicators (referred to
as “annual monitoring indicators” by FFP and more generally) to track performance of development
food security activities and to allow USAID to more comprehensively capture Feed the Future results.
9
The revised set of Feed the Future IM indicators cover the following sectors: agriculture and livelihoods;
5
Note that it is not always feasible to collect data on all of a project’s participants, e.g., when the number of participants is very
large.
6
The vision of the strategy is “a world free from hunger, malnutrition, and extreme poverty, where thriving local economies
generate increased income for all people; where people consume balanced and nutritious diets, and children grow up healthy
and reach their full potential; and where resilient households and communities face fewer and less severe shocks, have less
vulnerability to the shocks they do face, and are helping to accelerate inclusive, sustainable economic growth.” For more
information, see https://www.usaid.gov/what-we-do/agriculture-and-food-security/us-government-global-food-security-
strategy.
7
The complete set of phase two Feed the Future IM indicators and their PIRSs can be found in the publication Feed the Future
Indicator Handbook, which is located at https://www.agrilinks.org/sites/default/files/ftf-indicator-handbook-march-2018-
508.pdf.
8
The remainder of this guide will make reference to the FFP and non-FFP parts of the Feed the Future Initiative as separate
entities when relevant.
9
Note that FFP has a number of annual monitoring indicators that are specific to FFP that are not typically used by non-FFP IPs.
The full set of FFP annual monitoring indicators can be found at https://www.usaid.gov/documents/1866/ffp-indicators-
handbook-part-ii-annual-monitoring-indicators.

Participant-Based Survey Sampling Guide for Feed the Future Annual Monitoring Indicators 4
maternal and child health and nutrition (MCHN); water, sanitation, and hygiene (WASH); resilience; and
gender.
Feed the Future requires all IPs to report annually on all indicators that relate to the various sectors for
which their projects have relevant components or interventions. Most Feed the Future IPs have
interventions in more than one of the sectors listed above. Because data collection mechanisms are
often determined by project delivery systems, which vary according to the various sectors,
10
the data
collection mechanisms may vary by indicator.
Although many Feed the Future IM indicators (which are henceforth referred to as “Feed the Future
annual monitoring indicators”) can be collected through projects’ routine monitoring systems, there are
some indicators that (under certain circumstances) might warrant using PaBSs for collection of the
associated data. Consultations with USAID FFP and Bureau for Food Security (BFS) staff, as well as Feed
the Future IP staff, suggested that collecting data for four particular Feed the Future annual monitoring
indicators relating to agriculture present challenges that might be overcome by using PaBSs. A
discussion of a few of these challenges is provided in Chapter 2.
The four indicators are:
1. Yield of targeted agricultural commodities among program participants with USG assistance
(henceforth referred to as “Yield of Agricultural Commodities”)
2. Value of annual sales of farms and firms receiving USG assistance (henceforth referred to as
“Value of Sales”)
3. Number of hectares under improved management practices or technologies with USG
assistance (henceforth referred to as “Number of Hectares under Improved Management
Practices”)
4. Number of individuals who have applied improved management practices or technologies with
USG assistance (henceforth referred to as “Number of Individuals Using Improved Management
Practices”)
The Feed the Future Agricultural Indicators Guide
11
focuses on earlier versions of these four indicators.
12
The guide discusses conceptual, definitional, and measurement aspects of the indicators, but does not
address data collection systems that might be required to gather the associated data. Furthermore,
10
Data collection mechanisms could also vary within sector. For example, some annual indicators are outputs and some are
outcomes. The data for output indicators are easily gathered through routine data collection, but the data for some of the more
complex outcome indicators may require a different approach.
11
The Feed the Future Agricultural Indicators Guide can be found at http://agrilinks.org/library/feed-the-future-ag-indicators-
guide.
12
Under phase one of the Feed the Future initiative, the four associated indicators were: i) Gross margin per unit of land,
kilogram, or animal of selected products; ii) Value of incremental sales (collected at the farm level) attributed to USG
implementation; iii) Number of hectares under improved technologies or management practices as a result of USG assistance;
and iv) Number of farmers and others who have applied improved technologies or management practices as a result of USG
assistance.

Participant-Based Survey Sampling Guide for Feed the Future Annual Monitoring Indicators 5
while PIRSs (which provide information on definitions, units of measurement, rationale, limitations,
expected levels of disaggregation, and basic measurement notes, among other things) are available for
all four of these annual monitoring indicators, they include suggestions but no detailed technical
guidance on appropriate data collection mechanisms and methods.
Both USAID FFP and BFS have indicated that Feed the Future IPs could benefit from further specific
guidance on survey data collection methods in support of these four agriculture-related annual
monitoring indicators (as well as other annual monitoring indicators, discussed in Annex 4). This guide
aims to respond to this need by providing detailed guidance on how to plan and design PaBSs to support
data collection for the four selected indicators, with particular attention given to the circumstances in
which a PaBS is indicated.
13
Although the main focus of this guide is on PaBSs in the context of
agriculture indicators, additional focus is given to PaBSs in support of other sectoral areas (such as
MCHN and WASH).
13
Note that prior to drafting this guide, the USAID-funded Food and Nutrition Technical Assistance Project (FANTA) undertook
exploratory work to obtain information on how project delivery systems and routine monitoring systems typically work across
the various Feed the Future agricultural projects, and how and when awardees conduct PaBSs.

Participant-Based Survey Sampling Guide for Feed the Future Annual Monitoring Indicators 6
2. The Four Selected Feed the Future Agriculture-
Related Annual Monitoring Indicators
The four selected agriculture-related annual monitoring indicators are all classified by Feed the Future as
“Required if Applicable” for Feed the Future projects. This means that data need to be collected on
these indicators if the projects have relevant agriculture-related interventions. This is the case for most
Feed the Future non-FFP projects and for many Feed the Future FFP projects.
The types of participants covered for each of the four indicators differ. For instance, smallholder
producers,
14
non-smallholder producers, people in government, people in private sector firms, people in
civil society organizations, and other value chain actors should be reported under the “Number of
Individuals Using Improved Management Practices” indicator, whereas sales of smallholder and non-
smallholder producers, private sector firms, and for-profit civil society organizations should be reported
under the “Value of Sales” indicator. Reporting for the ”Number of Hectares under Improved
Management Practices” indicator should include area in hectares for all producers and people in civil
society organizations working on both “intensive” interventions (i.e., crop lands, cultivated pastures,
aquaculture), as well as “extensive” interventions (i.e., rangelands, conservation/protected areas,
freshwater or marine ecosystems). Finally, the “Yield of Agricultural Commodities” indicator should be
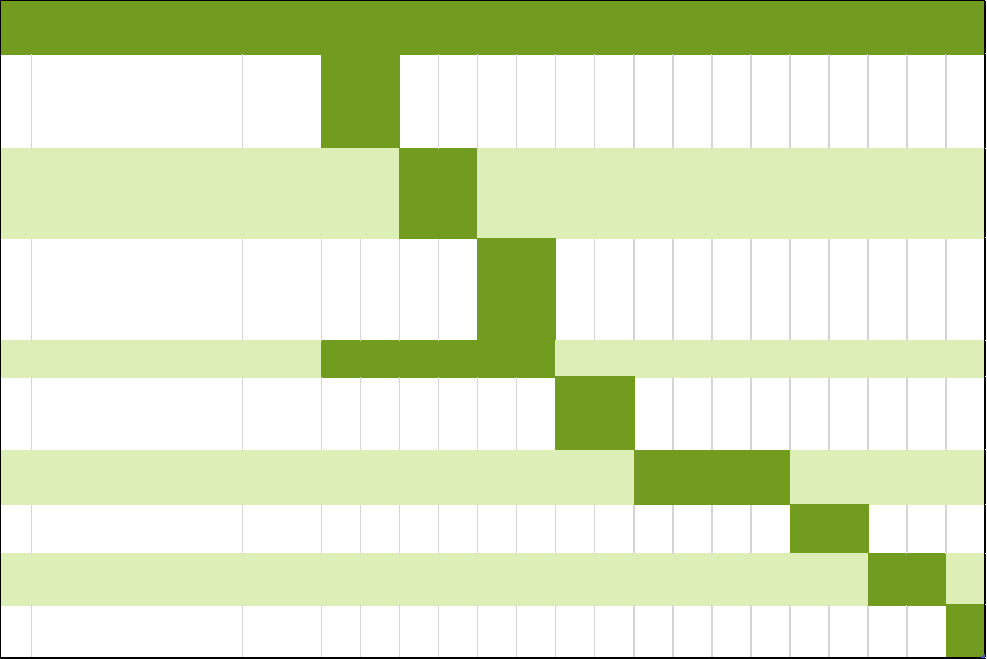
reported for all producers working within crop, livestock, or aquaculture production systems. Therefore,
the participants covered by the “Yield of Agricultural Commodities” indicator are a subset of the
participants covered by the ”Number of Hectares under Improved Management Practices” indicator,
who in turn are a subset of the participants covered by the “Value of Sales” indicator, who in turn are a
subset of the participants covered by the “Number of Individuals Using Improved Management
Practices” indicator. Table 1a provides a representation of the participants covered by the four
indicators.
Note that although the “Number of Individuals Using Improved Management Practices,” “Value of
Sales,” and “Number of Hectares under Improved Management Practices” indicators include more than
just producers and extend to others in the value chain, this guide focuses only on participant
producers. This is because Feed the Future projects are likely to have different mechanisms to collect
data on the other actors (e.g., people in private sector firms) in the value chain. Furthermore, for
practical reasons, this guide focuses on participant producers who reside in a fixed location where they
can be found. Table 1b provides a summary of how the four indicators relate to each other, as well as a
summary of the participants who are the focus of this guide for these four indicators.
14
Producers include farmers, ranchers, and other primary sector producers of food and nonfood crops; livestock and livestock
products; fish and other fisheries or aquaculture products; agro-forestry products; and natural resource-based products,
including non-timber forest products, such as fruits, seed, and resins. A farmer is a type of producer that focuses on cultivating
crops or raising livestock.

Participant-Based Survey Sampling Guide for Feed the Future Annual Monitoring Indicators 7
Table 1a. How the Four Indicators Overlap
Indicator
Producers
Civil society
organizations
Private
sector
firms
Government, extension
services, research
organizations, and other
value chain actors
Yield of Agricultural Commodities
Number of Hectares under
Improved Management Practices
Value of Sales
Number of Individuals Using
Improved Management Practices
Table 1b. Indicators and Their Associated Participants
Indicator
Types of participants included as part of
indicator definition
Subset of participants who are the
focus of this guide*
Number of Individuals
Using Improved
Management Practices
Smallholder and non-smallholder
producers, people in government,
people in private sector firms,
people in civil society organizations,
and other value chain actors
Smallholder and non-smallholder
producers in crop, livestock, and
aquaculture production systems
Value of Sales
Smallholder and non-smallholder
producers, private sector firms, and
for-profit civil society organizations
Smallholder and non-smallholder
producers in crop, livestock, and
aquaculture production systems
Number of Hectares
under Improved
Management Practices
Smallholder and non-smallholder
producers and people in civil society
organizations managing area
intensively or extensively
Smallholder and non-smallholder
producers in crop, livestock, and
aquaculture production systems
Yield of Agricultural
Commodities
Smallholder and non-smallholder
producers in crop, livestock, and
aquaculture production systems
Smallholder and non-smallholder
producers in crop, livestock, and
aquaculture production systems
* Even though the subset of participants who are the focus of this guide is the same for all four indicators, for Feed the Future
FFP IPs, many participants may report a zero value for sales because they are subsistence farmers who consume most or all of
what they produce; regardless, all participant values should be reported.
Additional detail on the four indicators is provided in the following sections.

Participant-Based Survey Sampling Guide for Feed the Future Annual Monitoring Indicators 8
2.1 The “Yield of Agricultural Commodities” Indicator
The “Yield of Agricultural Commodities” indicator has two component parts that are combined to form
the overall indicator. The indicator estimate is calculated using the following formula:
=
where:
TP = quantity (volume) of total production in kilograms, metric tons, numbers, or other units
UP = number of hectares planted (for crops), number of animals (for milk or eggs), number of
hectares (for aquaculture in ponds), or number of crates (for aquaculture in crates)
It is important to note that this indicator is not reported at the overall level; rather, the highest level of
reporting for this indicator is by commodity type. This is an important aspect of the indicator that must
be taken into account in the strategy for computing the overall sample size for a PaBS; this is described
in more detail in Section 9.2.5. Note that in the Feed the Future Indicator Handbook, the PIRS for this
indicator lists commodity type as the first level of disaggregate, although in effect commodity type is the
highest level at which the indicator is reported and so is not really a disaggregate. In addition to
commodity type, the “Yield of Agricultural Commodities” indicator must also be reported at nested
lower levels of disaggregation. For instance, for producers of crops, the second level of disaggregation is
by farm size (smallholder and non-smallholder), and the third level of disaggregation is by sex (male and
female) and by age (15–29 and 29+).
Each of the equation’s two component parts is an important data point in its own right, as it provides
important information that can be used to monitor project progress with respect to outcomes. Once
estimates of the two components of “Yield of Agricultural Commodities” are produced by Feed the
Future IPs, they should be entered into the Food for Peace Management Information System (FFPMIS)
or the Feed the Future Monitoring System (FTFMS). These systems then automatically produce
estimates for the “Yield of Agricultural Commodities” indicator.
15,16
The collection of data supporting the two component parts of the “Yield of Agricultural Commodities”
indicator has its own set of challenges and complexities, which are discussed in detail (in relation to the
associated archived Feed the Future annual monitoring indicator “Gross Margins”) in the Feed the
Future Agricultural Indicators Guide.
One of the challenges of this indicator is obtaining an accurate measurement for the “number of
hectares planted” component, when referring to crops. While historically farmer estimates of surface
15
While there are two component parts (i.e., data points) to this indicator, an additional data point on the number of
participant producers of each commodity is also required by FFPMIS and FTFMS. These data can be obtained directly from the
sample frame of participants if the sample frame contains information on the commodities cultivated/raised by each
participant. If that information is not available, the total number of participant producers of each commodity can be estimated
by applying the percent of participant producers of each commodity in the sample to the total number of project participant
producers.
16
Estimates of the two components are entered in these systems at the lowest level of nested disaggregates, and the systems
then automatically aggregate to higher levels. Please see the PIRS in the Feed the Future Indicator Handbook for more details.
Participant-Based Survey Sampling Guide for Feed the Future Annual Monitoring Indicators 9
area have not been considered very accurate, more-recent evidence shows that farmer estimates are
sometimes quite accurate, although “inaccuracies” might arise in the following ways:
• Smallholder farmers tend to overestimate area while larger farmers tend to underestimate area.
• The accuracy of farmer estimates is reported to decrease with increasing plot size.
• The accuracy of farmer estimates of area increases with the farmers’ level of familiarity with area
measurement units.
Thus, in cases where farmer estimates may not render accurate results (e.g., for non-smallholder
farmers or farmers with limited familiarity with area measurement units), survey implementers should
consider taking direct measurements of farmer plots.
2.2 The “Number of Hectares under Improved Management
Practices” Indicator
The “Number of Hectares under Improved Management Practices” indicator has the same measurement
issues as the “number of hectares planted” component (for crops) of the “Yield of Agricultural
Commodities” indicator discussed above (e.g., farmer estimates that lead to potential inaccuracy).
Although there would appear to be an added measurement complexity due to the necessity to restrict
the estimate to only the land mass under improved management practices or technologies, once a
farmer has identified that an improved technology (say) is used on a particular crop, the PIRS guidance
suggests that projects should assume that 100% of the hectares planted with that crop have the
technology applied to it.
2.3 The “Value of Sales” and “Number of Individuals Using Improved
Management Practices” Indicators
The measurement challenges related to the “Value of Sales” and “Number of Individuals Using Improved
Management Practices” indicators are discussed in the Feed the Future Agricultural Indicators Guide,
although the guide references earlier versions of these indicators.

Participant-Based Survey Sampling Guide for Feed the Future Annual Monitoring Indicators 10
ROUTINE MONITORING VERSUS
PARTICIPANT-BASED SURVEYS
CHAPTERS
3. Comparison of Routine Monitoring and Participant-Based Surveys .................. 11
4. When Are Participant-Based Surveys Appropriate? .......................................... 14

Participant-Based Survey Sampling Guide for Feed the Future Annual Monitoring Indicators 11
3. Comparison of Routine Monitoring and
Participant-Based Surveys
3.1 Overview
This chapter provides a brief description of routine monitoring and PaBSs, as well as the salient features
and advantages of each approach. A comparison of the two approaches gives Feed the Future IPs a
sense of what is entailed in terms of resources, time, systems, and skills so that they can make informed
decisions about which approach is most appropriate given programmatic circumstances and constraints.
In general, performance monitoring systems collect, transmit, process, and analyze data for project
performance tracking, planning, and decision making. The components are part of a management
information system that includes: data collection and aggregation tools, databases, reporting tools, and
standardized indicator definitions. They may also include data quality assurance tools or checklists. Data
collected in performance monitoring systems help determine if project implementation is running on
schedule and meeting interim targets during the life of the project. Mid-course corrections can be made
if it appears that, based on an analysis of the collected data, a project or a component of a project is not
on track. Data are typically collected in support of such systems through either routine monitoring or
PaBSs.
3.2 Description and Features of the Approaches
3.2.1 Routine Monitoring
Agriculture data collected through routine monitoring is usually undertaken by specialized project staff
(such as M&E personnel or agricultural extension workers), either concurrently with the implementation
of project interventions (such as during producer group [PG] meetings or agricultural extension worker/
technical staff field visits to farmers’ individual plots) or through regularly scheduled visits that are not
undertaken concurrently with implementation of interventions but that coincide with key points in the
production cycle. However, data are typically aggregated monthly or quarterly (or even more frequently
given the advent of cloud technology) to provide timely information for project tracking, planning, and
management.
The data collected during routine monitoring typically support indicators at the output and lower-level
outcome levels, and all relevant data relating to indicators are ideally collected from all direct project
participants. As such, routine monitoring requires a sufficient number of field staff (e.g., agricultural
extension and M&E staff, community development workers, volunteers, and promoters) to ensure
sufficiently frequent contact with all participants throughout the year to collect all necessary data. This
may be particularly difficult for projects with a large number of participants, where a large number of
staff might be necessary to fulfill all the data collection needs.
In the case where there is a visit to the participant farmers’ plots as part of routine monitoring, direct
measurement of various data points, such as hectares, can easily be taken. This may be an advantage,
as, in many cases, it results in improved accuracy of such data. In contrast, data collected when PGs

Participant-Based Survey Sampling Guide for Feed the Future Annual Monitoring Indicators 12
convene typically rely on farmer estimation/recall, which can result in data that are less accurate, as
noted earlier (although it usually is of acceptable accuracy for performance monitoring purposes).
3.2.2 Participant-Based Surveys
PaBSs refer to specialized periodic surveys conducted among the project participant population. In the
case of agricultural projects or agricultural components of projects, data are collected on a random
sample or subset of project participant producers during a visit to their households and/or farming
plots—although it is also possible to take a random sample of PGs from among all those convened for
those projects that use PGs as a project delivery mechanism, e.g., farmer field schools (FFSs). The
collection of data is typically not linked to project implementation as it usually is for routine monitoring,
except in the instance of sampling PGs mentioned above.
The surveys are usually implemented a fixed number of times per year (usually 1–4 times) and
conducted at periods during the year that are often related to the agricultural cycle (e.g., planting,
harvesting, sale) and the reporting cycle. In order to appropriately collect information on participants
who are part of different project interventions (for example, agriculture production strengthening
versus livelihood strengthening), separate surveys may be required if the participant registries are
different for these interventions. However, for both routine monitoring and PaBSs, care is needed to
aggregate the data across different time points in the year to ensure that no double counting of data
from individual participants occurs.
3.3 Advantages of Each Approach
3.3.1 Advantages of Routine Monitoring
Some key advantages to using routine monitoring as a means of collecting annual monitoring data are
listed below:
• In project designs where routine monitoring and project interventions are integrated into one
process (such as in projects that collect data from individual farmers at the same time that PG
meetings are held), there is no need for a separate mechanism for data collection.
• All projects have routine monitoring systems in place, regardless of whether or not they conduct
PaBSs. In this sense, the use of routine monitoring for data collection on annual monitoring
indicators may be less resource intensive than the use of PaBSs because, in the latter case, a
separate, additional (and substantial) resource investment is required that would otherwise not
be necessary.
17
However, when all annual monitoring data are collected through routine
monitoring, there may also be a substantial cost to engaging an increased number of M&E staff
year round.
17
The exception to this is when projects opt to send M&E specialists to collect data from all participants at their plots several
times a year as a separate and additional routine monitoring exercise, as noted earlier in the guide.

Participant-Based Survey Sampling Guide for Feed the Future Annual Monitoring Indicators 13
• The collection of data through routine monitoring does not require specialized skills in survey
design and implementation (although it does require skills in questionnaire development and
design), and, therefore, there is less of a need to hire an external contractor.
18
• Using routine monitoring, data are usually collected on all participants (i.e., a “census” of the
participant population is taken), and, therefore, there is no need to produce sampling weights,
confidence intervals, or standard errors of the estimates, as there is with PaBSs.
19
In this sense,
data analysis of data collected through routine monitoring is much simpler than data analysis of
data collected through PaBSs, the latter of which typically requires the analysis of complex survey
data.
• Because data collection using routine monitoring often occurs on an ongoing basis, data can more
easily be collected at multiple points in the production cycle, at multiple harvests for a particular
crop, or at different harvest times for a variety of crops. This will likely result in more-accurate
data. Multiple PaBSs would need to be conducted to capture analogous data on multiple points,
harvests, or crops—or, at a minimum, annually administered PaBSs would need to include the
scope for data recall at multiple time points throughout the year. As a result, routine monitoring
data can be fed back to project staff more frequently than data collected with PaBSs can.
3.3.2 Advantages of Participant-Based Surveys
The following is a list of advantages to using PaBSs as a means of collecting data in support of annual
monitoring indicators:
• PaBSs allow for direct measurements to be taken on key data points (such as “Number of Hectares
under Improved Management Practices”) through a visit to the farmers’ plots, and this may result
in higher-quality data. In contrast, for projects where routine monitoring data are collected during
PG meetings only and where farmer recall is used to obtain data on area, if direct measurements
were desired, visits to the participant farmers’ plots by an agriculture extension worker would be
required. While in principle project staff should visit at least a significant proportion of participant
plots during the year, this may not always happen in practice.
20
• The number of participants from whom data are collected is much smaller for PaBSs than for
routine monitoring because data are collected on only a random sample (or subset) of
participants for the former, while data are ideally collected on all participants for the latter. Note,
however, that it can be logistically difficult to collect, aggregate, and analyze data on all
participants through routine monitoring for projects with a very large number of participants.
18
It is important to note, however, that data collection through routine monitoring requires staff with a substantial
understanding of the data points to be collected and of the basic principles of questionnaire development and design, and the
interviewers must have the requisite skills to record and analyze the data accurately. Therefore, even with routine monitoring,
appropriate training is necessary.
19
It should be noted that although confidence intervals and standard errors of the estimates are not required in the reporting
of annual monitoring indicators for Feed the Future projects, it is a good practice to calculate them to provide a sense of the
quality of the data estimates produced when using PaBSs.
20
However, in the case where field visits to farmer plots are undertaken, better-quality estimates of area may result because
the project staff who collect data have a much better understanding of the farmers’ plots and crops relative to interviewers
from external contractors.

Participant-Based Survey Sampling Guide for Feed the Future Annual Monitoring Indicators 14
4. When Are Participant-Based Surveys
Appropriate?
There are certain situations in which it is preferable to use PaBSs over routine monitoring. There are
other situations in which a combination of routine monitoring and PaBSs is the most effective way to
collect the appropriate data. This chapter outlines three scenarios for which PaBSs may be warranted,
either in isolation or in combination with routine monitoring.
4.1 Scenario #1: Large Project Size/Inadequate Number of Data
Collection Staff
There are many Feed the Future projects that have tens of thousands—even hundreds of thousands—of
participants. Although projects of this size frequently have large numbers of agricultural extension
workers and M&E staff, it can still be difficult from both a resource and a logistical perspective to collect
all relevant agriculture-related data on all participants. A survey with a representative sample of the
participant population can be an appropriate alternative in this case.
In these cases, annual monitoring data for Feed the Future projects can be collected through a
combination of routine monitoring and PaBSs. For example, one Feed the Future IP implementing
projects with a large number of participants in a variety of countries deemed it infeasible to collect all
data points on all participants through routine monitoring, despite having a large number of staff
engaged in M&E activities. Therefore, this IP collects basic “count” data (such as data supporting
“Number of individuals participating in USG food security programs”) on all participants through routine
monitoring, but also conducts PaBSs several times a year on a sample of participants to collect some of
the more complex data on production and sales in relation to the “Yield of Agricultural Commodities,”
“Value of Sales,” and other indicators. The survey data are sample weighted to represent the entire
participant population (more details on sample weighting is discussed in Chapter 11), and the data
collected through the two mechanisms are combined and stored in a large, comprehensive, proprietary
database.
It is important to note that data for Feed the Future annual monitoring indicators relating to other, non-
agriculture sectors (e.g., MCHN and WASH) also need to be collected and reported in the annual
monitoring process. Even if a PaBS is used by a project to collect data for some of the indicators related
to the agricultural component, data related to other sectors may be collected either through routine
monitoring or through separate PaBSs, depending on the circumstances. Thus, using a PaBS to collect
data in relation to agricultural data may not entirely solve the issue of the data collection burden for
large projects, because the number of participants under other non-agricultural components might also
be very large, necessitating separate PaBSs using different sample frames in those instances as well.
Therefore, the development and maintenance of multiple data collection systems is a necessary reality
for most annual monitoring systems. The issue of conducting PaBSs in support of annual monitoring
indicators for the MCHN and WASH sectors is discussed in more detail in Annex 4.

Participant-Based Survey Sampling Guide for Feed the Future Annual Monitoring Indicators 15
4.2 Scenario #2: Farmer Estimates of Area Considered Unreliable and
Direct Measurement of Plots Preferred
Projects that integrate routine monitoring with project implementation by collecting data through PGs
generally use farmer estimates to obtain information on several relevant data points. As noted earlier, in
some instances (e.g., for non-smallholder farmers or farmers with limited familiarity with area
measurement units), recall can be unreliable for the collection of information, specifically on hectares in
support of both the “Yield of Agricultural Commodities” and “Number of Hectares under Improved
Management Practices” indicators. Direct measurement via a PaBS conducted at the farmers’ private
plots may be preferable in such instances.
It is important to keep in mind that all Feed the Future IPs must collect data for a diverse range of
annual monitoring indicators, above and beyond the four agricultural indicators that are the focus of this
guide. While a PaBS might be the best option for collecting high-quality data for some of the more
complex indicators (such as those that involve information on hectares), routine monitoring might be
the preferable option of data collection for those other indicators. Each project should determine
whether it would be preferable to live with less-accurate data for a few of the more complex indicators
and to use routine monitoring for the collection of data on all indicators.
4.3 Scenario #3: Lack of Direct Contact between a Project and Its
Participants
Some projects do not have a direct link with their participants by design, for example, project
implementation that focuses on engagement with agricultural businesses, where the businesses are
trained by the project using a value chain facilitation approach, and the expectation is that these
businesses will in turn provide technical advice to participants. In these cases, using routine monitoring
to collect annual monitoring data would be difficult, as the project has no direct contact with its
participants at any point during implementation.
To address this issue, it might be possible to ask the agricultural businesses to collect the requisite
annual monitoring data on behalf of the project. However, this approach may lead to low-quality data,
as there is little incentive for businesses to invest in such data collection unless a business case can be
made for how the information is useful to them. Therefore, in this circumstance, project implementers
could carry out a PaBS to collect all relevant agriculture-related annual monitoring data, provided that a
comprehensive, accurate, and up-to-date list of participants exists or can be created to serve as a
sampling frame.
21
21
Alternatively, the project could define the catchment area served by the value chain actors that they are facilitating, consider
all the producers within that catchment area as participants, and conduct a PaBS within that catchment area. See the
introduction section of the Feed the Future Indicator Handbook, and the “Application of Improved Practices and Technologies”
webinar (https://www.agrilinks.org/event/new-indicators-application-improved-practices-and-technologies-feed-future-mel-
webinar-series) for more detail on this approach.

Participant-Based Survey Sampling Guide for Feed the Future Annual Monitoring Indicators 16
PARTICIPANT-BASED SURVEYS:
IMPLEMENTATION ISSUES
CHAPTERS
5. Timing and Frequency of Participant-Based Survey Data Collection ................. 17
6. Issues to Consider when Outsourcing Work to an External Contractor............. 19

Participant-Based Survey Sampling Guide for Feed the Future Annual Monitoring Indicators 17
5. Timing and Frequency of Participant-Based
Survey Data Collection
The timing and frequency of PaBSs are important considerations when planning for annual monitoring
activities. If a project chooses a PaBS as a chief vehicle for collecting data in support of annual
monitoring, then the survey should be conducted at least once per year, given that Feed the Future
requires annual reporting.
In the case of an annual PaBS, 12-month recall may be used to collect all the required agricultural data.
However, it may be advantageous to implement surveys more frequently in order to shorten the recall
period to improve the accuracy of the data collected. For instance, a project could collect data on
certain inputs and hectares at the time of planting, and could collect information on other inputs,
production, and sales at or shortly following the harvest. Furthermore, if a project promotes multiple
value chains corresponding to multiple crops that are harvested at different times of the year, it may
improve accuracy to conduct separate surveys during the planting and/or harvesting periods. Finally, it
might also be advantageous to collect data (and hence to conduct PaBSs) several times per year for a
single crop, in the event that the crop has several plantings and/or harvests in a single year.
If a Feed the Future IP decides to collect data more frequently than once a year, one approach used to
decide the timing of data collection is to obtain—or map out with project participants—a seasonal
calendar of agriculture-related interventions. A seasonal calendar helps highlight the critical moments of
the year during which agricultural interventions occur related to the various crops in question. With the
calendar in hand, the next logical step is to analyze the available resources (budget, staff, etc.) and time
constraints to determine how frequently data collection can occur.
It is also useful to have an accurate sense of the time required to conduct a survey from beginning to
end, particularly if a project needs to decide whether to plan one or multiple surveys in a year to
correspond with specific seasonal events. A survey timeline is usually drafted in the form of a Gantt
chart and provides a projection of the expected number of weeks that a survey needs from start to
finish, as well as the number of days or weeks that each particular activity needs. Such a chart can help
avoid common problems with planning for the survey work, such as insufficient time allocated for
activities and neglecting to take into account the interrelationships between activities.
The illustrative timeline in Figure 1 provides some guidance on the minimum amount of time that
should be allocated for some of the activities that are essential to carrying out a PaBS. The timeline
assumes that, if an external contractor is used, additional time is required at the front end to draft and
advertise a scope of work (SOW), to interview and select an external firm, and to draft and sign a
contract between the parties. These additional activities are not included in the timeline below, but
could entail several months of work and need to be finalized before the survey can start.
Participant-Based Survey Sampling Guide for Feed the Future Annual Monitoring Indicators 18
Figure 1. Illustrative Timeline for a Participant-Based Survey
Task
#
Task description
Estimated
number of
days
1 2 3 4 5
6 7 8 9 10 11 12 13 14 15 16 17
1
Develop and finalize survey
design (sample size calculation,
development of sampling
frame, survey design)
10 days
2
Develop and translate draft
survey instrument(s) (in English
and in relevant local languages)
10 days
3
Develop, translate, and finalize
survey training agenda and
materials (in English and in
relevant local languages)
10 days
4
Recruit interviewers 30 days
5
Train interviewers, and pre-test
and finalize survey
instrument(s)
10 days
6
Collect data 20 days
7
Enter, clean, and analyze
collected survey data
10 days
8
Draft survey report and
integrate comments
10 days
9
Prepare dataset for submission 5 days
Discussions about the timing and frequency of data collection activities should begin during the project
design phase, as decisions have an impact on budgets and potentially on staffing. It is important that
these decisions take into consideration time availability and resource constraints to ensure that data
collection and analysis activities can be effectively and efficiently implemented.

Participant-Based Survey Sampling Guide for Feed the Future Annual Monitoring Indicators 19
6. Issues to Consider When Outsourcing Work to
an External Contractor
Depending on the circumstances, a project can elect to implement the survey internally or to hire an
external contractor to implement the survey. There are distinct advantages to using an external
contractor to conduct a PaBS. For instance, a contractor can provide highly specialized expertise in
survey methodology and data analysis techniques—skills that project staff often do not possess. An
external contractor can also relieve the time pressures of implementing a survey from the IP, thereby
freeing the project staff to focus on project implementation.
There are also disadvantages to using an external contractor. First and foremost, it will almost certainly
be more expensive to use a contractor to implement a survey than it will be to engage in-house staff. In
addition, identifying and selecting a qualified external contractor can be time consuming, and it is often
difficult for project staff with limited survey experience to make informed judgments regarding the
quality of proposed candidates for the work. Furthermore, the internal project staff member overseeing
the activity needs to have an appropriate level of survey-related knowledge to develop the SOW for the
contractor, to properly manage the work of the contractor, and to adequately review survey
deliverables.
Conducting a PaBS entails a number of important activities, including:
1. Designing the sampling plan
2. Drafting the survey questionnaire instruments to elicit data on the relevant indicators
3. Developing training materials and field procedure manuals
4. Recruiting and training interviewers
5. Managing the logistical and administrative aspects of the fieldwork
6. Implementing data collection
7. Managing data entry, and cleaning and analyzing the survey data
8. Writing the survey report and presenting the survey results
An external contractor can be hired and tasked with any or all of the required activities.
22
Any
combination of splitting the responsibilities for these activities between an external contractor and
internal staff members from the project is also possible. Regardless of the assigned responsibilities, it is
always necessary to clearly designate an internal staff member from the project to oversee the work of
the external contractor. This authority should be explicitly detailed in the SOW for the contractor, as
should the process by which survey deliverables are to be reviewed and approved.
The decision to engage an external contractor to conduct a PaBS is usually based on one or more of the
following factors: budget, internal staff time, and internal staff expertise. Once the decision has been
22
Note that project staff can be involved in the actual collection of data (as can external interviewers), but, in this case, they
require special training on administering survey questionnaires and on the appropriate survey protocols in the field.
Participant-Based Survey Sampling Guide for Feed the Future Annual Monitoring Indicators 20
made to engage an external contractor, there are several other issues that must be given due
consideration. These are outlined in the following sections.
6.1 Time and Effort Required to Procure and Manage an External
Contractor
An IP must invest considerable time and effort in various elements related to the procurement of the
external contractor, including:
1. Drafting and internally vetting a SOW for the external contractor
2. Advertising the SOW
3. Interviewing and selecting the external contractor
4. Drafting, reviewing, and approving the contract
It is critical that an IP consider the time needed for these essential activities (which can be several
months) when deciding whether or not to use an external contractor, as the survey cannot start before
they have been completed. The IP should also take into account the considerable time required for
adequate management of an external contractor throughout the survey process.
6.2 Importance of a Good Scope of Work to Guide the Process
A clear and comprehensive SOW is a key element in the successful oversight of an external contractor. A
good SOW helps set expectations, facilitates the management of the contractor, and provides quality
control measures on survey deliverables. A shortened version of the SOW can be used to advertise for
an external contractor.
The SOW should clearly delineate the responsibilities of both the contractor and the Feed the Future IP
engaging the contractor. It should provide information on key survey design features and details on the
expected survey activities, deliverables, and timeline. It should also clearly outline the indicator(s) for
which data should be collected, as well as required disaggregates that must be reported.
A template for a SOW to advertise for or to manage a contractor conducting a PaBS can be found in
Annex 1. Feed the Future IPs can use this template as a starting point and add specificity to serve their
particular needs.
Feed the Future IPs can request that external firms respond to a wide variety of elements in the
proposals that they submit in reply to an advertised SOW. These elements help IPs make a
determination regarding which firm is most appropriately suited to undertake the work. The elements in
the proposal should include, at a minimum, a technical write-up outlining how the firm intends to
undertake the work, a budget, a detailed timeline, a proposed survey team with accompanying
individual CVs, and evidence of past relevant experience.
Note that the survey team proposed by the external firm should consist of key personnel with a mix of
defined technical and subject matter expertise. At a minimum, the key personnel should include a
survey team leader, a senior survey specialist, and a field operations manager. Annex 2 contains a set of
illustrative job descriptions for each of these key personnel. Sometimes members of survey teams take
Participant-Based Survey Sampling Guide for Feed the Future Annual Monitoring Indicators 21
on the responsibilities of multiple roles within the team, but what is important is that all of the different
required competencies are present within the team.
Application materials from contractors should always include examples of reports from past complex
household and/or participant-based surveys that candidate contractors have designed and
implemented.
6.3 Judging the Expertise of Potential External Contractors
Priority should be placed on recruiting a contractor that has adequate internal specialization in survey
methodology and questionnaire development, as well as in managing data collection in the field. A
contractor needs survey expertise relating to sample size calculations, stratification, clustering, sample
selection using multiple stages and unequal probabilities of selection, and sample weight creation. In
addition, the contractor should have experience in implementing household and/or participant-based
surveys (i.e., the implementation of survey protocols, field logistics, data collection, and the oversight of
interviewers) in developing countries, where ground realities for data collection can be considerably
different, and often more difficult, than in developed countries.
It is often difficult for IP project staff with limited survey experience to make informed judgments
regarding the quality of potential candidate firms that respond to an advertised SOW. To assist projects
in assessing the appropriateness of such firms, Annex 3 of this guide contains a “Checklist for Engaging
External Contractors.” The checklist outlines a set of factors that projects should consider when
choosing contractors from among the firms that have submitted proposals for the work.

Participant-Based Survey Sampling Guide for Feed the Future Annual Monitoring Indicators 22
PARTICIPANT-BASED SURVEYS: SAMPLING
FRAMES AND SURVEY APPROACHES
CHAPTERS
7. Sampling Frame Guidance for Participant-Based Surveys ................................. 23
8. Overview of Various Approaches for Collecting Annual Monitoring Data
Using Participant-Based Surveys ........................................................................ 27

Participant-Based Survey Sampling Guide for Feed the Future Annual Monitoring Indicators 23
7. Sampling Frame Guidance for Participant-
Based Surveys
This chapter discusses the sampling frame and its critical importance in the survey-taking process. A
sampling frame is the backbone of all PaBSs. It comprises one or more complete lists of all project
implementation “clusters” and/or all project participants—from which a representative sample can be
randomly drawn for the survey. In this case, “cluster” refers either to the lowest level of geographic area
covered by the project (typically village or community) or to PGs. Without such frame(s), it is impossible
to conduct a representative survey.
A high-quality survey frame should be comprehensive, complete, and up to date. “Comprehensiveness”
refers to the type of information that is included on the frame, while “completeness” refers to the
extent to which information on all entities (i.e., villages/communities or PGs and/or participants) is
reflected on the frame. It is important that the frame be actively maintained so that it will always be as
current (i.e., up to date) as possible. This means that the list of villages/communities or PGs in which the
project operates must be kept current; if new villages/communities or PGs are integrated into the
project over time, they must be added to the survey frame. This also means that participant registration
systems should keep close track of participants who are new entrants to the project and, if project
implementers are interested in doing so, participants who are graduates from the project
23
—and the
former of these should be reflected on the frame, whereas the latter should be reflected if possible.
Participants who drop out from the project interventions for whatever reason (e.g., unavailability,
migration, disinterest, death) should be dropped from the frame.
7.1 Information to Include on a Sampling Frame
Three survey design options for conducting PaBSs are introduced below and are discussed in detail in
Chapter 9.
The first survey design option uses two-stage cluster sampling, for which two separate sampling frames
are required. In this case, the “first stage cluster frame” consists of the list of villages/communities
24
(or
any other geographic entity, more generally called “clusters”) served by the project, from which villages/
communities are randomly selected at the first stage of sampling. The “second stage participant frame”
23
The Feed the Future Agricultural Indicators Guide states, “Farmers and others that have graduated from an activity remain
direct [participants] for the duration of the activity. If IPs have the required resources to continue tracking [participants] after
they graduate, they can be counted as long as they continue to apply technologies or practices promoted through your
activity.” https://www.agrilinks.org/sites/default/files/resource/files/FTF_Agriculture_Indicators_Guide_Mar_2015.pdf, p. 70.
24
In contrast to PaBSs, PBSs often use enumeration areas (EAs) defined by the national census (rather than villages/
communities) as the basis for the first stage cluster frame, because the population and/or household counts that are needed
for sampling are readily available for each EA from the census. One of the difficulties in using EAs is that the correspondence
between EAs and the villages/communities in which IPs work is not always straightforward. Fortunately, PaBSs (unlike PBSs)
need not use EAs as a basis for the first stage cluster frame given that population and/or household counts are not required for
sampling. Instead, counts of participants from project records are required. Therefore, for PaBSs, the villages and/or
communities in which IPs work are better suited than EAs for inclusion on the first stage cluster frame.

Participant-Based Survey Sampling Guide for Feed the Future Annual Monitoring Indicators 24
consists of the list of participants served by the project, from which participants are randomly selected
from the sampled clusters at the second stage of sampling.
The second survey design option, which also uses two-stage sampling, requires only the first stage
cluster frame prior to fieldwork, because the second stage participant frame is created in the field
through a listing operation.
The third survey design option employs a “one-stage sampling design,” for which only the second stage
participant frame is required, from which participants are directly sampled.
A fourth survey design option is introduced in Chapter 10. This design uses two-stage sampling, where
clusters are PGs that are selected at the first stage of sampling, and where all participants in the selected
PGs are selected at the second stage. For this survey design option, both a first stage cluster frame
consisting of PGs and a second stage participant frame are required.
In general, for the first stage cluster frame (consisting of the set of implementation villages/
communities or PGs) to be considered “comprehensive,” it should include, at a minimum, the following
information:
• Unique ID number for the cluster (e.g., village/community or PG)
• Name of the cluster (e.g., village/community or PG)
• Location of the cluster (e.g., census geographic code or global positioning system [GPS]
coordinates)
• Information on all appropriate higher-level geographic areas (e.g., province or district)
• Number of project participants in the cluster
For the second stage participant frame (consisting of the population of participants served by the
project) to be considered “comprehensive,” it should include, at a minimum, the following information
for each project participant
25
:
• Unique participant and/or household ID number (if assigned by the project)
• Participant’s complete name
• Participant’s age and sex
• Participant’s household location (e.g., address or relative location, GPS coordinates)
• Village name/community name or PG ID to which the participant belongs
• The location of the village/community or PG (e.g., census geographic code or GPS coordinates, if
available)
• Any higher geographic levels (e.g., province or district) in which the household is located
25
Technically speaking, a comprehensive list of all participants is needed only in the case of one-stage sampling (third survey
design option) because participants are sampled directly from this frame. For all three of the other survey design options, which
entail two-stage sampling, a comprehensive list of participants is needed only for each of the sampled clusters.

Participant-Based Survey Sampling Guide for Feed the Future Annual Monitoring Indicators 25
There is additional information that should be included on the second stage participant frame if feasible
and affordable:
• Cellular telephone number, if applicable (to help locate and contact the participant)
• Spouse’s name, if applicable (to help contact the participant)
• Date at which individual became a project participant and/or graduated from the project (useful if
participants enter and exit the project on a rolling basis)
• Project interventions in which the participant is active (for cases where the project implements a
variety of interventions for different sets of participants), including which of the project’s targeted
commodities the participant produces
• Whether the participant is a smallholder producer or a non-smallholder producer
For the second stage participant frame to be considered “complete” and “up to date,” all current (and
graduated, if feasible) project participants should be included on the frame, and, for each participant,
the above information should be accurate and recent.
There should be no duplicate listings of the same participant on the frame, and, for any duplicate listings
that are identified, one of the listings should be eliminated.
26
Similarly, care should be taken to ensure
that unique participants with similar or identical names are distinguished and that each unique
occurrence is kept on the second stage participant frame. The use of participant information on age, sex,
and name of spouse can be used effectively to help distinguish participants with similar or identical
names.
Finally, projects might serve multiple participants from within the same household. Care should be taken
to ensure that all participants in a given household, along with their relevant information, are included
on the second stage participant frame.
7.2 Participant Registration Systems as a Source of Establishing
Sampling Frames
Many Feed the Future IPs have systems that register all project participants for both programmatic and
reporting purposes.
27
Such systems are also essential as a foundation for routine monitoring data
collection. Furthermore, they are used to develop both first and second stage sampling frames for a
PaBS. Therefore, it is critical that projects invest in establishing and maintaining such systems if they
wish to develop representative sampling frames as a basis for conducting PaBSs.
Participant registration systems can vary in the type of information that they store on project
participants. However, many participant registration systems are not comprehensive or up to date, and
contain either less information than is necessary to establish a sampling frame (i.e., the information
26
It is possible that one participant producer cultivates/raises multiple commodities that are targeted by the project.
Regardless, there should be one unique record for each producer, with an indication of all commodities cultivated/raised by
that producer.
27
One reason for having such a register is that Feed the Future FFP IPs and non-FFP IPs need to report on the indicator
“Number of individuals participating in USG food security programs.” An exhaustive list of participants would facilitate
reporting on this indicator, which requires a count of unique individuals in such programs.

Participant-Based Survey Sampling Guide for Feed the Future Annual Monitoring Indicators 26
itemized in the last section) or incomplete information on all project participants. While not ideal, there
are survey design options that can accommodate this shortcoming. For instance, one of the survey
design options described in this guide integrates in-the-field creation of a second stage frame of
participants through a “listing” process of each of the sampled villages/communities. This approach
assumes that there is an accurate first stage cluster frame available from which to sample. It is
important to note that there are substantial additional resources required to list in the field. Therefore,
projects that use this design to conduct PaBSs in a particular year should aim to improve their
participant registration systems so that more-optimal designs can be used in subsequent years.
7.3 Frames for Multiple Participant-Based Surveys Conducted in the
Same Year
Because Feed the Future IPs may introduce new participants over a project’s life span while graduating
others, participant registration systems (and other project lists that serve as a basis for sampling frames)
should be continually updated.
28
The dynamic nature of participant registration systems can present
challenges for PaBSs that are conducted several times a year (as described in Chapter 5).
Combining the estimates from distinct surveys conducted at various points in a given year using
different versions of a sampling frame and drawing a different set of sampled participants can be
misleading. For instance, if a project elects to conduct two surveys in a particular year, one after
planting (to collect data on inputs used and hectares planted) and another after harvest (to collect data
on any additional inputs used later in the year, as well as production and sales), adding together the
input estimates from the two time points is not meaningful if different participants are sampled in each
survey.
To minimize any potential problems that can arise from this issue, survey implementers should use the
same set of sampled participants who are drawn from the sample frame used for the first survey for all
surveys conducted in the same year, even if the number of project participants has changed between
survey occasions. This effectively means conducting a set of longitudinal surveys on the same set of
sampled participants within a given year. Because the same set of sampled participants is interviewed
for each survey, the sample weights (see Chapter 11) will be the same for each survey occasion,
29
and
therefore estimates from the various surveys in the same year can be readily combined.
Once all PaBSs have been completed in a particular year, the sampling frame can be updated (adding
new entrants to the project while, if desired, maintaining graduated project participants) so that it may
be used in PaBSs conducted in the year that follows.
28
The frequency of such updates needs to be determined in accordance with what is appropriate for each individual Feed the
Future project and depends on how static or dynamic the set of participants is. At a minimum, IPs should update registries
annually, but more frequently is highly recommended if feasible.
29
It is important to note that there will usually be some attrition over time when using the same set of sampled participants in
a series of PaBSs. Non-response at each survey occasion needs to be accounted for through a non-response adjustment (see
Section 11.2 for more details), so, strictly speaking, sample weights over time using the same participants will not be identical.

Participant-Based Survey Sampling Guide for Feed the Future Annual Monitoring Indicators 27
8. Overview of Various Approaches for Collecting
Annual Monitoring Data Using Participant-
Based Surveys
This chapter outlines two different PaBS approaches. Each approach has different time, resource, and
data-quality implications. The determination of which approach is most appropriate depends on the
service delivery mechanisms used by the project, as well as the circumstances surrounding the need to
conduct a PaBS (see Chapter 4). The two survey approaches are:
1. Household survey approach
2. PGs approach
8.1 Approach 1: Household Survey Approach
The “household survey approach” consists of a PaBS as a distinct and separate exercise from project
implementation and routine project monitoring. A random sample of participants is selected using a
one-stage or two-stage design (more details on these designs are provided in Chapter 9), and interviews
are held with project participants at their households and/or individual farmer plots (for crop-focused
producers). The data from the survey are sample weighted so that the estimates are representative of
all project participants. All agricultural data related to the project’s set of annual monitoring indicators
that are suitable to collect through a PaBS
30
may be collected through this mechanism. Data can be
collected solely by interviewing the participant or through a combination of direct measurement,
observation, and participant interview. The combination approach is usually fairly time- and resource-
intensive, but can yield (under certain circumstances) more accurate results for certain data points
where direct measurement is used (such as for hectares).
A special application of this approach can also be used to improve estimates based on farmers’ recall of
hectares (for crop-focused producers), by taking a direct measurement of farmers’ plots for a
representative sample of participant farmers.
31
Regression analysis can then be conducted and a
correlation coefficient between the two measurements used to build the regression model (i.e., farmer
estimates and physical measurements of area) can be computed. A correction factor based on the
correlation coefficient can then be applied to farmer estimates of area for the rest of the participant
farmer population for which direct measurements were not taken. Past uses of this approach by Feed
30
One important criterion to determine suitability of indicators for which data are to be collected is if the indicators track the
activities of the same set of participants for which data are collected on the four agricultural indicators.
31
Note that a physical measurement on land areas needs to be taken only once, unless there is reason to believe that access to
land or land ownership by farmers changes substantially over the life of the project.

Participant-Based Survey Sampling Guide for Feed the Future Annual Monitoring Indicators 28
the Future IPs have shown that correlations between farmer estimates and direct measurement have
ranged from 0.70 to 0.95.
32,33
Approach 1 is appropriate if the project has a large number of participants coupled with an inadequate
number of data collection staff so that it is considered infeasible to collect all agricultural data through
routine monitoring (whether or not it is deemed essential to obtain a direct measurement on some
indicators, such as those relating to hectares), as outlined in Scenario 1 of Chapter 4.
Even if the project is not large, if visits to farmer plots are not a routine part of project implementation,
the household survey approach is also appropriate if it is deemed essential to obtain a direct
measurement on some indicators, such as those relating to hectares when dealing with non-smallholder
farmers or farmers with poor familiarity with area measurement units, as outlined in Scenario 2 of
Chapter 4.
This approach can also be used when the project has no direct contact with project participants for the
agricultural component, as outlined in Scenario 3 of Chapter 4. The use of a PaBS under the scenario of
no direct contact still presents the challenge that a comprehensive, complete, and up-to-date sampling
frame of participants must be available from which to draw the sample. This highlights the need for
those organizations that do have direct contact with project participants (e.g., input suppliers) to
develop and maintain high-quality “customer lists” from which participant registration systems and
sampling frames can be developed.
34
Therefore, there is likely a need for such projects to engage the
businesses that they train (who in turn have direct contact with participants) to provide substantial
inputs to the participant registration systems.
For more details on Approach 1, see Chapter 9.
8.2 Approach 2: Producer Groups Approach
The “producer groups approach” uses surveys of PGs to collect the data in support of annual monitoring.
In this case, one or more surveys of participant farmers take place during the periodic meeting of a PG,
e.g., at a FFS.
To implement this approach, a sample of PGs is selected from among all active PGs, and all of the
participant producers (rather than a sample of them) within the selected PGs are interviewed at the
next meeting of a PG.
35
From this sampled group of participant producers, data relating to the four
agricultural indicators or any other agricultural outcome indicators that are relevant to the same set of
32
For more details on how to improve estimates of hectares using regression analysis, see: Fermont, A. and Benson, T. 2011.
Estimating yield of food crops grown by smallholder farmers: a review in the Uganda context. International Food Policy
Research Institute (IFPRI) Discussion Paper 01097.
33
For this particular method, a sample size of at least 30 farmers (on which direct measurements of their plots are taken) is
necessary for statistical inference.
34
See the Feed the Future Agricultural Indicators Guide, http://agrilinks.org/library/feed-the-future-ag-indicators-guide, p. 7,
for related guidance.
35
In the Feed the Future context, there are typically 15–30 producers in a PG and therefore it is feasible to interview all
producers within a sampled PG. In the rare cases where a PG is larger, a subsample of producers can be interviewed. However,
this will introduce an additional stage of sampling.
Participant-Based Survey Sampling Guide for Feed the Future Annual Monitoring Indicators 29
participants can be collected. The data from the survey are sample weighted so that the estimates are
representative of all project participants.
Data on producers’ attributes are collected using producer recall and estimates. Because direct
measurements (e.g., on hectares) are not taken, there is no need to visit individual participant
households and/or plots for the survey component. For this reason, it is logistically efficient to use the
PG as a first stage cluster in lieu of the village or community, the latter of which is traditionally used in
household surveys. Thus, the main advantage to this approach is that the survey component is less time-
and resource-intensive than the household survey approach, as it is not necessary to locate and travel to
the households or plots. However, a disadvantage is the potential loss of accuracy due to the use of
producer recall and estimates.
This approach is suitable only for those projects that use the PG approach as the agriculture service
delivery mechanism for the interventions that the four agricultural indicators track. This approach
addresses the challenge that projects using the PG service delivery mechanism encounter if they have a
large number of participants coupled with an inadequate number of data collection staff, so that it is
considered infeasible to collect all agricultural data through routine monitoring, and, at the same time, it
is not deemed necessary to procure a direct measurement for data, such as hectares, because farmer
estimates are considered reasonably accurate (as in the case of smallholder farmers or farmers with
good familiarity with area measurement units).
For more details on Approach 2, see Chapter 10.
8.3 How to Choose the Right Approach
Figure 2 summarizes the decision-making process for deciding which of the two approaches is most
appropriate for a given project. Note that if the project has direct contact with participants and does not
have a large pool of participants and it is deemed that direct measurements are not necessary, then the
best option is to collect all relevant data through routine monitoring. Alternatively, if the project has
direct contact with participants and does not have a large pool of participants, but it is deemed that
direct measurements are necessary and visits to farmer plots (during which measurements on plot sizes
can be taken) are a routine part of project implementation, then the best option is to collect all relevant
data through routine monitoring.
8.4 Details on the Two Approaches
The next two chapters (Chapters 9 and 10) provide details on the two approaches described in this
chapter. Chapter 9 provides detailed information on the various steps of the survey design process for
the household survey approach. The chapter outlines three survey design options under this approach
and how to choose from among them, how to calculate the sample size for the survey, how to choose
the number of clusters to select, how to randomly select a sample of clusters in accordance with that
number, and how to randomly select survey respondents within sampled clusters. Chapter 10 provides
detailed information on the PGs approach.

Participant-Based Survey Sampling Guide for Feed the Future Annual Monitoring Indicators 30
Figure 2. Determining Which Approach Is Most Appropriate

Participant-Based Survey Sampling Guide for Feed the Future Annual Monitoring Indicators 31
THE TWO APPROACHES
CHAPTERS
9. The Household Survey Approach (Approach 1) ................................................. 32
10. The Producer Groups Approach (Approach 2) ................................................... 75

Participant-Based Survey Sampling Guide for Feed the Future Annual Monitoring Indicators 32
9. The Household Survey Approach (Approach 1)
This chapter provides details on how to implement
the household survey approach. Three survey
design options are suggested for the household
survey approach. The simplest survey design option
involves only one stage of sample selection, while
two more-complex survey design options involve
clustering and two stages of sample selection. Once
a survey design option is chosen (from among the
three options), there are a number of additional
steps to be followed. All three survey designs have
two steps that are common to them: calculating the
sample size and selecting survey respondents. The
two more-complex survey design options have two
additional steps: choosing the number of clusters to
select and selecting a sample of clusters. Figure 3a
provides a visual representation of these steps. The
details for each of the steps are outlined in the
sections that follow.
9.1 Choosing a Survey Design
Option
The three recommended survey design options under the household survey approach are:
• Survey design option 1: Two-stage cluster design with systematic selection of participants
• Survey design option 2: Two-stage cluster design with a listing operation and systematic selection
of participants
• Survey design option 3: One-stage design with systematic selection of participants
The following sections briefly describe each of these options.
9.1.1 Survey Design Option 1: Two-Stage Cluster Design with Systematic Selection of
Participants
The two-stage cluster design with systematic selection of participants survey design option requires a
first stage cluster frame (consisting of a complete set of project implementation clusters, i.e., villages or
communities) and a second stage participant frame (consisting of the complete list of participants
within all sampled implementation clusters served by the project). At the first stage of sampling, a
random sample of clusters is selected from the first stage cluster frame. At the second stage of
sampling, participants from the second stage participant frame for each of the sampled clusters are
Figure 3a. Steps in the Approach

Participant-Based Survey Sampling Guide for Feed the Future Annual Monitoring Indicators 33
randomly selected and interviewed. (More details on first and second stage sampling are provided in
Sections 9.4 and 9.5.)
In general, a two-stage cluster sampling design is preferred over a one-stage sampling design in most
cases, because direct sampling of participants in one stage can be logistically difficult, particularly if
there is a large number of clusters in which the project is implemented; the difficulty is exacerbated if
travel between the clusters is challenging due to distance or physical conditions. To elaborate, if a
project selects participants directly using one-stage systematic sampling, then, if the cluster sizes are
roughly equal, the result is a random selection of an approximately equal number of participants from
almost every cluster in which the project works. If the project operates in a large number of clusters,
particularly where the clusters are geographically spread out or difficult to access, it will be costly and
logistically burdensome to visit all project clusters for the purposes of survey. In this case, a two-stage
cluster sampling approach may be preferable to economize on the time and resources expended,
because it allows for surveying in only a subset of the project clusters (rather than in all of them).
However, one of the main disadvantages of using a two-stage cluster design is that, in order to account
for the increase in sampling error due to clustering, the sample size likely has to be significantly larger
than what would be required for a simple one-stage design using systematic sampling.
36
Still, if it is
deemed that the cost savings and logistical ease of surveying in some, not all, clusters under two-stage
sampling is a reasonable offset to the additional burden of the increased cost of a greater sample size
under one-stage sampling, then a two-stage cluster design should be chosen.
9.1.2 Survey Design Option 2: Two-Stage Cluster Design with a Listing Operation and
Systematic Selection of Participants
The second survey design option under the household survey approach also uses a two-stage cluster
design, but has an additional listing operation between the first and second stages of sampling.
Both two-stage cluster design options require the existence of a first stage cluster frame (consisting of a
complete set of project implementation clusters) for sample selection at the first stage. The main
difference between survey design options 1 and 2 is that in option 1, the project must have a second
stage participant frame in hand before fieldwork commences, while in option 2, there is no requirement
to have a comprehensive, complete, and up-to-date list of participants within all sampled clusters at the
time of first-stage sampling.
For survey design option 2, the first stage sampling of clusters is identical to that of survey design
option 1. However, before a second stage selection of participants occurs, a listing operation is
undertaken in the field in each of the clusters selected for sampling (see Section 9.5.2 for more detailed
information on listing operations), and in doing so, a second stage sampling frame is created dynamically
while in the field. The listing can be created by walking through the sampled cluster and identifying
households in which participants reside. After the listing is created, the second stage of sampling is
identical to that of survey design option 1, namely, a random systematic sample of participants within
the sampled clusters is selected for interviewing.
36
In addition, data analysis is more complicated for two-stage cluster designs than it is for one-stage designs.
Participant-Based Survey Sampling Guide for Feed the Future Annual Monitoring Indicators 34
Because an additional step—a listing operation—is needed during survey implementation, the choice of
this survey option design usually necessitates a longer timeline (several days to several weeks),
depending on the number of clusters that must be listed and the resources available (e.g., the number
of interviewers available).
Generally speaking, this option is suitable when two-stage sampling is warranted (as explained in
Section 9.1.1) and when a second stage participant frame does not exist.
9.1.3 Survey Design Option 3: One-Stage Design with Systematic Selection of
Participants
For the one-stage design with systematic selection of participants, it is essential that there be a
comprehensive, complete, and up-to-date second stage participant frame (consisting of the complete
list of participants within all implementation clusters served by the project). However, unlike options 1
and 2, there is no requirement for a first stage cluster frame (consisting of a complete set of project
implementation clusters) because there is no sampling of clusters.
In general, there are two ways to sample participants directly using one stage of sampling: systematic
sampling and simple random sampling (SRS). In systematic sampling, the complete list of participants is
ordered by cluster and a subset of the participants is selected using a fixed interval across the entire list.
If the cluster sizes are roughly equal, roughly the same number of participants is selected from each
implementation cluster, and every (or almost every) implementation cluster is included in the sample
(assuming the sample size is greater than or equal to the number of implementation clusters). In
contrast, in SRS, a sample of participants is selected without regard to the cluster in which they belong.
In this case, one cannot determine in advance how many participants from each implementation cluster
will be in the sample, or even how many of the implementation clusters will be in the sample. At the
extremes, either one participant or all participants might be selected from any given cluster. Depending
on the sample that is drawn, this can result in fieldwork that is very costly and inefficient from a
logistical point of view, given the unpredictable geographic spread of the sample. Therefore, when
sampling participants directly using one stage of sampling, it is always preferable to use systematic
sampling over SRS.
Survey design option 3 using systematic sampling is most suitable when there is a modest number of
clusters in which the project is implemented and where travel conditions between clusters are not
difficult. This is particularly true when the project covers villages within a reasonably compact
geographical area and all participants can be accessed easily and relatively quickly. In this case, it is not
logistically burdensome to use systematic sampling of participants, which may result in travel to all (or
nearly all) project clusters.
When the number of clusters is large, implementing systematic sampling can become logistically
challenging. For example, if a project has 65,000 participants across 300 clusters and wishes to sample
500 participants, then, under a one-stage systematic sampling design, the 500 participants would be
sampled from the sample frame of all 65,000 participants (sorted by cluster) by selecting every 130th
farmer (65,000 / 500 = 130) across the 300 clusters. In this case, the resultant sample will span all or
almost all of the 300 clusters and only 2–3 participants will be sampled in each cluster, which is a
logistically inefficient design. Therefore, in this case, a two-stage design should be used instead. If, on
the other hand, the project works in only 25 clusters, then, although it would still be necessary to visit all

Participant-Based Survey Sampling Guide for Feed the Future Annual Monitoring Indicators 35
or almost all of the 25 clusters, 20 participants per cluster would be sampled, making it much more
logistically efficient to use one-stage sampling.
9.1.4 Summary of the Recommended Survey Design Options under the Household
Survey Approach
Table 2 summarizes the main characteristics of the three recommended survey design options.
Table 2. Summary of the Main Characteristics of the Three Recommended Survey
Design Options
Option
number
Survey design option
Sampling frame
requirements
Sample
size
Other implications
1
Two-stage cluster design
with systematic selection
of participants
Comprehensive, complete,
up-to-date list of clusters
and participants
Larger
More-complicated data analysis
(due to clustering)
2
Two-stage cluster design
with a listing operation
and systematic selection
of participants
Comprehensive, complete,
up-to-date list of clusters
only
Larger
More time and resources needed
due to listing operation AND
more-complicated data analysis
(due to clustering)
3
One-stage design with
systematic selection of
participants
Comprehensive, complete,
up-to-date list of
participants only
Smaller Easiest data analysis
The flowchart in Figure 4 describes how two criteria lead to the choice of the appropriate survey design
option.
9.1.5 A Cautionary Note on the Use of Lot Quality Assurance Sampling
There is a survey design called Lot Quality Assurance Sampling (LQAS) that is sometimes used by
humanitarian and development projects, and, when properly executed, is an appropriate option to
consider for projects measuring categorizations of “success” or “failure” of various initiatives. Such
categorizations of success or failure can be made in each “supervision area” or other relevant
geographic area related to management, using very small sample sizes—which is viewed as a substantial
cost savings by survey practitioners. A byproduct of this approach is that estimates of totals at higher
levels of geography (e.g., at the province or district level) can be constructed with reasonable precision
by “summing the results” across these geographic areas. However, if the primary aim of a survey is to
produce estimates of totals (as is the case for most Feed the Future IPs) rather than to construct
categorizations of “success” or “failure,” then LQAS is a logistically inefficient design because it allocates
very small sample sizes to a large number of geographic areas (akin to clusters). Therefore, the survey
design options discussed in the previous sections are more appropriate and survey implementers should
not use an LQAS design to collect data for the annual monitoring indicators.

Participant-Based Survey Sampling Guide for Feed the Future Annual Monitoring Indicators 36
Figure 4. How to Choose the Appropriate Survey Design Option
9.2 Calculating the Sample Size for All Survey Design Options of the
Household Survey Approach
After choosing the survey design option, the next
step in the survey design process for the household
survey approach is to calculate the sample size. This
section starts by describing the different types of
surveys and indicators and the different sample size
calculations associated with each. The various
indicators that can drive the sample size calculation
are discussed, and a formula for determining the
initial sample size is provided. Each of the input
parameters to the initial sample size calculation is
described in depth, and recommendations on how
to estimate the input parameters are given. Three
multiplicative adjustments to the initial sample size
formula are provided, to permit the computation of
a final sample size for the household survey
approach. Illustrative examples are provided
throughout the section.
Figure 3b. Steps in the Approach
Participant-Based Survey Sampling Guide for Feed the Future Annual Monitoring Indicators 37
9.2.1 Types of Surveys and Indicators
The formulas used to calculate sample size depend on two factors: the type of survey and the type of
indicator.
The first factor is the type of survey. There are two types of surveys that are typically conducted by Feed
the Future IPs: descriptive and comparative analytical.
• The first type of survey, a descriptive survey, is one in which data are collected at a single point in
time in order to provide a snapshot of a situation. For these surveys, the intention is to achieve a
reasonable level of precision (i.e., a small standard error) for estimators by controlling the sample
size. These are typically the types of surveys that are conducted in support of annual monitoring
by Feed the Future IPs.
• The second type of survey, a comparative analytical survey, is one where the main aim is to
conduct statistical tests of differences between estimates—typically where the underlying data
are collected at different points in time (e.g., at project start and project end) and typically for
indicators of proportions or means. For these surveys, the intention is to provide a sample size
that controls the levels of inferential errors associated with the statistical tests of differences.
These are typically the types of surveys that are conducted in support of performance evaluations
(using baseline, interim, or end-line surveys).
The two types of surveys use different formulas to calculate the overall sample size. The formulas for
descriptive surveys are simpler and tend to result in smaller sample sizes than those for comparative
analytical surveys, although this is not always the case. The aim of PaBSs for annual monitoring is to
provide a variety of single-point-in-time estimates of indicators, where the precision of the estimates is
controlled. Feed the Future projects cannot conduct tests of differences on most annual monitoring
indicators over time because most annually reported indicators reflect estimates of totals and a
statistical test of differences for totals does not exist. Furthermore, an increase in an indicator of a total
over successive years may reflect an increase in the quantity being measured, but may also reflect an
increase in the number of participants with whom the project is working—and it is difficult to
disentangle the two phenomena. Therefore, survey implementers should use the formulas associated
with descriptive surveys when conducting PaBSs.
The second factor that influences the formula to use to calculate sample size for a PaBS is the type of
indicator. There are several types of indicators (collected through either PaBSs or PBSs) for which data
can be collected through sample surveys, for example, means or averages (e.g., “Per Capita
Expenditure”), proportions (e.g., “Percentage of Female Participants of USG Nutrition-Sensitive
Agriculture Activities Consuming a Diet of Minimum Diversity”), and totals (e.g., “Number of Hectares
under Improved Management Practices” or “Value of Sales”).
The majority of Feed the Future agriculture-related annual monitoring indicators (i.e., IM indicators) are
totals, although a few take the form of proportions.
Each type of indicator (mean, proportion, and total) necessitates a different formula for calculating the
associated sample size. Three of the four focus indicators covered by this guide are totals (i.e., “Number
of Hectares under Improved Management Practices,” “Number of Individuals Using Improved
Management Practices,” and “Value of Sales”), so the use of a formula that is based on a total is

Participant-Based Survey Sampling Guide for Feed the Future Annual Monitoring Indicators 38
appropriate for these three indicators; this formula is described in detail in the next section.
37
The fourth
indicator, “Yield of Agricultural Commodities,” can be expressed as a ratio of two totals. Because no
sample size formula exists for an indicator of ratios, this indicator is treated as a mean for the purposes
of this guide.
38
The sample size formula for an indicator of means is described in Annex 4.
9.2.2 Calculating the Sample Size
Indicators to Use as a Basis for Sample Size Calculation
When calculating an overall sample size for a PaBS, it must be kept in mind that the survey may collect
data in support of a number of annual monitoring indicators, each having its own sample size
requirement. However, one indicator only, from among all indicators on which data are to be collected
through the survey, can determine the overall sample size for the survey. The challenge lies in selecting
that indicator.
The general recommendation is that the sample size for all key indicators from among the indicators
being collected in the survey be calculated and that the largest sample size resulting from all candidate
sample sizes computed be chosen.
In the case of PaBSs in support of agriculture-related indicators, the recommended key indicators on
which to base the sample size calculation are the following six indicators, based on the four indicators
that are the focus of this guide:
1. “Number of Hectares under Improved Management Practices”
2. “Number of Individuals Using Improved Management Practices”
3. “Value of Sales”
4. “Yield of Key Agricultural Commodity A”
5. “Yield of Key Agricultural Commodity B”
6. “Yield of Key Agricultural Commodity C”
As noted earlier, the “Yield of Agricultural Commodities” indicator is not reported at the overall level;
rather, the highest level of reporting for this indicator is by commodity type. A separate sample size
calculation is necessary for each commodity because the parameters that form the basis of the sample
size computation, such as mean and standard deviation, vary by commodity. Because the total sample
size for the PaBS may become unmanageable if all commodities being supported by a project are
37
It is acknowledged that IPs may also wish to undertake PaBSs in support of other sectors, such as MCHN. In this case, key
indicators often take the form of proportions or means. The sample size computation for indicators of proportions or means is
addressed in Annex 4.
38
The difference between an indicator of ratios and an indicator of means is subtle. For the former, it is assumed that both the
numerator and the denominator are estimated as totals (see Chapter 12 for more details). For the latter, it is assumed that the
denominator is a fixed, known quantity that represents the target population under consideration (e.g., the number of project
participants). By treating an indicator of ratios as an indicator of means, there is some loss of precision in the estimate because
the denominator is treated as fixed (as an indicator of means), and therefore the variability that would stem from estimating
the denominator (as an indicator of ratios) is not accounted for.

Participant-Based Survey Sampling Guide for Feed the Future Annual Monitoring Indicators 39
included, Feed the Future recommends that IPs base sample size calculations on the three most
important commodities (i.e., those most widely cultivated/raised, denoted A, B, and C)
39
and compute
the sample size for yield for these three key commodities separately. This is reflected above in indicators
4, 5, and 6.
Formula to Calculate the Sample Size Based on a Total
The formula for calculating the initial sample size for the estimation of indicators of totals (such as
indicators 1, 2, and 3 above) is given by:
=
=
where:
N = total number of participants
z = critical value from the Normal Probability Distribution
s = standard deviation of the distribution of participant data
MOE = margin of error
Components of the Formula
The following section provides a description of each of the components of the sample size formula given
above, along with recommendations on how to estimate each of them.
Total Number of Participants (N). The first component of the formula is N, which is the total number of
participants in the relevant project interventions tracked by the above indicators at the time of the
design of the survey. However, each of the three candidate indicators encompasses a slightly different
universe, according to its specific definition (see Table 1a) and, for the purposes of this guide, is limited
to include the universe described in Table 1b. The limited universe for purposes of this guide is defined
as “smallholder and non-smallholder producers in crop, livestock, and aquaculture production systems”
for all three indicators.
Critical Value from the Normal Probability Distribution (z). The next component is z, the critical value
that is a fixed value from the Normal Probability Distribution, which is one of the most commonly used
probability distributions in statistics and which follows the well-recognized “bell” shape. The point on
the Normal Probability Distribution curve corresponding to a 95% “confidence level”
40
is typically
chosen; this corresponds to a critical value of 1.96 on the Normal Probability Distribution. Therefore,
39
IPs in Feed the Future target countries should prioritize the same key commodities for annual monitoring as the Feed the
Future country teams prioritize for the Zone of Influence PBS.
40
A confidence interval is a measure of the precision of an estimate and is expressed as a range of numbers that have a specific
interpretation. If a large number of surveys was repeatedly conducted on the same participant population and if confidence
intervals were calculated for each survey, 95% of the confidence intervals would contain the true population value for the
indicator. The “confidence level” associated with such a confidence interval is 95%. A confidence interval should not be
interpreted to mean that there is 95% probability that the true population value falls within a specific survey’s confidence
interval, which is a common misinterpretation. See Chapter 13 for details on how to compute confidence intervals.

Participant-Based Survey Sampling Guide for Feed the Future Annual Monitoring Indicators 40
Feed the Future IPs should use a fixed value of z = 1.96 for the purposes of calculating sample sizes in
the current context.
Standard Deviation of the Distribution of Participant Data. The third component of the sample size
formula is s, the standard deviation of the distribution of participant data. This standard deviation is a
measure of dispersion in the participant-level data around the central value in the sample distribution
and provides an indication of how much variation there is in the individual data points. The standard
deviation is expressed in the same units as the indicator, and can be calculated directly from survey
data.
Note that in the context of Feed the Future projects, values for the standard deviation calculated from
survey data will be available for the second and subsequent years that IPs conduct PaBSs, because the
values can be computed directly using the data from the survey(s) conducted in the previous year.
However, the first year that IPs conduct such surveys there may be no estimates for the standard
deviation available.
In the event that an estimate for the standard deviation is not available (because it is the first year a
PaBS is conducted), a rough estimate can be derived using the following formula
41
:
()
=
( )
( )
6
Plausible maximum and minimum values for an individual participant are estimated by the IP, using
experience and expert knowledge as guides.
EXAMPLE A
For the “Number of Hectares under Improved Management Practices” indicator, an IP might estimate
that a participant in the project area could have a farm size that ranges between 0.5 hectares and 4.0
hectares, and the participant may choose to apply new management practices or technologies on a
portion of his or her land ranging from none of it to all of it. In this case, the minimum value of the
indicator for any given participant is 0 and the maximum value is 4. Applying the above formula gives a
standard deviation of (4 − 0) / 6 = 0.667 hectares.
EXAMPLE B
For the “Value of Sales” indicator, an IP may estimate that a participant in a particular country could
have a current year’s value of sales that ranges between US$0 and US$1,200. In this case, the maximum
value for the participant is 1,200 and the minimum value is 0. Applying the above formula gives a
standard deviation of (1,200 − 0) / 6 = US$200.
41
This approximation for the standard deviation of the distribution is derived from the fact that three standard deviations from
the “central point” or mean of the distribution cover roughly 99.7 percent of the distribution, assuming an underlying Normal
Probability Distribution. The entire range of the distribution (maximum − minimum) then covers roughly six standard
deviations. Hence one-sixth of the entire range (maximum – minimum) equals approximately one standard deviation.

Participant-Based Survey Sampling Guide for Feed the Future Annual Monitoring Indicators 41
EXAMPLE C
For the “Number of Individuals Using Improved Management Practices” indicator, a participant will be
counted as either a “yes” in terms of using the new management practice or technology (coded as a 1)
or a “no” in terms of not using the new management practice or technology (coded as a 0). In this case,
the maximum value for a participant would be 1 and the minimum value would be 0. Note that for this
indicator, we are not measuring attributes of a participant (such as hectares or value of sales), but rather
number of participants themselves. This is the reason that the “attribute value” of a particular
participant is either a 0 or a 1. (The underlying statistical distribution is “Bernoulli,” which means that
the only values that are possible are 0 and 1 for individual participants.) In this case, the above formula
for standard deviations does not apply. Instead, and in the absence of any other information, survey
implementers can use a “rule of thumb” value of 0.5 participants for the standard deviation (because
the standard deviation from a Bernoulli distribution is 0.5, assuming that 0 and 1 are equally likely
values for a given participant to assume).
42
Margin of Error (MOE). The final component of the sample size formula is MOE, the margin of error,
which is the half-width of a confidence interval around the estimate of the indicator of a total, and is
expressed in the same units as the indicator used as a basis for the sample size calculation. A smaller
MOE results in a larger sample size, whereas a larger MOE results in a smaller sample size.
There is no generalized rule of thumb for specifying the value of the MOE to use in the sample size
calculation relating to indicators of totals. However, an estimate can be obtained for the MOE using the
following formula:
=
This
formula has two terms. The first term, p, denotes an acceptable percentage error, and is typically
subjectively specified to range between 5% and 10% (expressed as p = 0.05 and p = 0.10, respectively).
Specifying p = 0.05 will result in a sample size that is greater (and often much greater) than specifying
p = 0.10. For purposes of Feed the Future annual performance monitoring for both FFP and non-FFP
projects, p = 0.10 should be used. More detail on this guidance is provided in Section 9.2.5. The second
term, target value of the indicator, is set by the IPs in their indicator performance tracking tables (IPTTs)
as the target value for the indicator to be achieved in the year in which the survey is being conducted.
43
EXAMPLE A (revisited)
If we revisit the earlier example for the “Number of Hectares under Improved Management Practices”
indicator, we can specify that we are willing to accept 10% error (p = 0.10), as per the Feed the Future
guidance. If we assume that we have N = 60,000 participants and we have set a target of 60,000
hectares under improved management practices or technologies across those participants, then MOE =
0.10 * 60,000 = 6,000. In other words, we are willing to accept a MOE of ±6,000 hectares in our estimate
of the total number of hectares cultivated under improved management practices or technologies
42
Strictly speaking, the receipt of the project’s intervention might make a value of 1 more likely than a value of 0. If survey
implementers feel that this is the case, a value that is greater than 0.5 and less than 1 can be used for the standard deviation,
but the particular choice of value between 0.5 and 1 is subjective.
43
If the PaBS is being designed to establish base year values for the project, then using target values to be achieved after one
year of project implementation does not make sense. In this case, it is recommended to use an estimated value of the indicator
obtained through external sources instead.
Participant-Based Survey Sampling Guide for Feed the Future Annual Monitoring Indicators 42
across all 60,000 participants. Alternatively, if we are willing to accept 5% error (p = 0.05), then
MOE = 3,000, but this more stringent specification would require a larger sample size.
EXAMPLE B (revisited)
Revisiting the earlier example for the “Value of Sales” indicator, suppose that we are willing to accept
10% error (p = 0.10) and we assume that N = 60,000 participants (as in example A). If we have set a
target of US$250 in sales for each participant, or a total target of US$250 * 60,000 = US$15 million, then
MOE = 0.10 * US$15 million = US$1.5 million. In other words, we are willing to accept a MOE of ±US$1.5
million in our estimate of the total sales across all 60,000 participants.
EXAMPLE C (revisited)
Finally, revisiting the earlier example for the “Number of Individuals Using Improved Management
Practices” indicator, suppose that we again specify that we are willing to accept 10% error (p = 0.10).
Again, if we assume that we have N = 60,000 participants, and we have set a target that 30,000 of them
who will apply new management practices or technologies, then MOE = 0.10 * 30,000 = 3,000.
Therefore, we are willing to accept a MOE of ±3,000 participants in our estimate of the “Number of
Individuals Using Improved Management Practices.”
Onc
e all of the input parameters for sample size calculation have been specified (the total number of
participants, N; the minimum and maximum values for the specification of standard deviation, s; the
target value of the indicator and the acceptable percentage error, p, for the specification of MOE), these
can be inserted into the formula for
to obtain the initial sample size.
The t
able below provides an illustrative example of calculating the initial sample size for the “Number of
Hectares under Improved Management Practices” indicator using a hypothetical sample size calculator.
In the example, the input parameters are specified by the user in the highlighted areas. For this
example, the population of participants is set at N = 60,000. There is no external estimate of standard
deviation available because this is the first year the PaBS is being conducted, and therefore the standard
deviation must be approximated. For the standard deviation computation, the minimum number of
hectares is specified as 0, while the maximum number of hectares is specified as 4. This results in a
standard deviation of s = 0.667 hectares. For the MOE computation, the “target value of the indicator” is
specified as 1 hectare for every participant (or 60,000 hectares across all participants), while the
“acceptable percentage error” is specified as 10% (p = 0.10). This results in a MOE of 6,000 hectares. For
an assumed 95% confidence level, the initial sample size is then computed to be
= 171.

Participant-Based Survey Sampling Guide for Feed the Future Annual Monitoring Indicators 43
Relationship between Formula Components and Sample Size
The following chart summarizes the relationship between the components of the initial sample size
formula (presented in Section 9.2.2) and the resulting initial sample size:
If there is an increase in the… …then the initial sample size:
Total number of participants (N) increases
Critical value (z) increases
Standard deviation (s) increases
Margin of error (MOE) decreases
Output of the Formula
The sample size calculation results in the total number of participants who need to be interviewed
(
) to achieve the targeted level of precision in the results (e.g., ±6,000 MOE or 10% error in the
last example). There are, however, potentially three adjustments that need to be made before the initial
sample size can be considered final: an adjustment for a small population of participants, an adjustment
for the design effect due to clustering, and an adjustment for anticipated individual non-response.
SURVEY DESIGN
OPTION
INDICATOR
Indicator title:
INITIAL SAMPLE SIZE
N
Population of participants 60,000
participants
Estimate of standard deviation available? NO
If YES, write estimate here: 10.00 units of indicator
If NO, provide best estimates of indicator
max
Estimate of maximum (per participant) 4.00
hectares
min
Estimate of minimum (per participant) 0.00
hectares
s
Standard deviation 0.667
= (4 - 0) / 6
p
Margin of error (acceptable percentage error) 10%
p=.10
Margin of error (target value of indicator)
60,000
MOE
Margin of error 6,000
= 0.10 x 60,000
Confidence level 95%
z
Critical value from Normal Probability Distribution 1.96
n
initial
Initial sample size 171
1 - Two-stage cluster desi gn with systematic s el ecti on of parti cipants
1 - Number of hectares under improved management practices or technologies with USG assistance
=
60,000
× 0.667
× 1.96
6,000

Participant-Based Survey Sampling Guide for Feed the Future Annual Monitoring Indicators 44
9.2.3 Adjustments to the Sample Size Calculation
Adjustment for a Small Population of Participants (Finite Population Correction)
The first adjustment that should be considered is called the finite population correction (denoted by
). This adjustment decreases the sample size in cases where the initial sample size,
, is 5%
or more of the total number of participants, N. That is to say that this adjustment is required if
0.05 . This usually happens when the population of participants served by the project is relatively
small.
44
In these cases, the sample size can be decreased from the initial sample size (
) because
each new survey respondent adds a smaller amount of new information than when the population of
participants is large.
This adjustment is often not necessary, as initial sample sizes are infrequently 5% or more of the
underlying population of participants listed on the sampling frame. However, a check should be made to
see if this is the case and if the adjustment is necessary.
If an adjustment is necessary, it is made by multiplying the initial sample size by the quantity given in the
following formula:
=
1
1 +
so that the adjusted initial sample size is:
=
=
1 +
If an adjustment is not necessary, let
= 1 in the above formula.
This
adjustment is required for all survey design options (i.e., options 1, 2, and 3) where the initial
sample size is 5% or more of the entire population of participants.
Adjustment for the Design Effect Due to Clustering
Survey design options 1 and 2 use a two-stage cluster design. A two-stage cluster design has greater
sampling error than that of the one-stage systematic sampling design of option 3. This is because survey
respondents within a cluster are likely to share similar characteristics in relation to some (or all) of the
indicators of interest. When this happens, the amount of new information that each new survey
respondent provides from within the same sampled cluster is less than that of a new respondent using a
systematic sampling design.
This
increase in sampling error due to the cluster survey design must be taken into account to reach the
targeted level of precision in the survey results. To do this, an adjustment to the sample size needs to be
made. This adjustment is made by multiplying the adjusted sample size
by a quantity called the
design effect due to clustering (denoted
).
44
In such cases, a PaBS is not recommended (because the project is not large) unless other conditions hold. See Chapter 4 for a
discussion of the circumstances under which PaBSs are appropriate.
Participant-Based Survey Sampling Guide for Feed the Future Annual Monitoring Indicators 45
Each indicator has its own separate design effect due to clustering relating to the degree of
homogeneity within the cluster in relation to that particular indicator. In principle, design effects can be
calculated only after a survey has been conducted. In the first year that IPs conduct such surveys, it may
not be possible to estimate the design effect due to clustering. In that case, the recommended practice
for estimating the cluster design effect is to look to survey reports that have been conducted using the
same (or similar) indicators on the same (or similar) survey population and ideally using the same
sample design (in particular, the same number of participants interviewed per cluster).
In t
he event that there are no previous surveys to use as a reference, a longstanding rule of thumb is to
use an estimate of
= 2 for the design effect for PaBSs that use one level of clustering (as
is the case in this guide). Survey implementers should follow this rule of thumb if no other source of
information with information on design effects is available prior to conducting the survey.
In t
he second and subsequent years that IPs conduct PaBSs, values for the design effect due to
clustering can be computed through statistical software directly using the data from the survey(s)
conducted in the previous year (assuming the survey design remains roughly the same).
This
adjustment is required only for survey design options 1 and 2 because design option 3 does not use
clustering. Therefore, for design option 3, let
= 1.
Aft
er applying the adjustment for the design effect due to clustering, the adjusted sample size,
,
can be expressed as:
=
=
Adjustment for Anticipated Individual Non-Response
Another adjustment that needs to be made relates to the anticipated individual non-response (denoted
by
-
). In all surveys, it is expected that some percentage of individuals selected for the
survey will be unreachable, unavailable, or unwilling to respond to any or all of the survey questions;
this is called individual non-response.
De
spite the best efforts of interviewers, there is usually some residual non-response that remains, even
after several attempts to complete an interview with participants selected for the sample. To ensure that
the targeted number of participants actually completes interviews despite individual non-response, the
initial sample size is pre-inflated by multiplying it by the inverse of the expected response rate so that the
resultant sample size after fieldwork is as close as possible to the targeted initial sample size.
The expected response rate can be estimated using information from past survey reports drafted by
other organizations conducting surveys in the same geographic area and with the same (or similar)
survey population as a guide. Such information might also be found in reports from large-scale
internationally sponsored surveys, such as the Demographic and Health Surveys (DHS), the Living
Standards Measurement Studies (LSMS), or the Multiple Indicator Cluster Surveys (MICS). However, use
of these sources may overestimate potential non-response, because project staff is likely to have an
established relationship with and knowledge of participants who are the survey respondents, and
therefore participants are more likely to respond to Feed the Future PaBSs. Even if project staff is not
directly involved in data collection, they can apprise participants of the upcoming survey and can urge
them to participate.

Participant-Based Survey Sampling Guide for Feed the Future Annual Monitoring Indicators 46
If no past information is available on non-response rates, a generally accepted rule of thumb is to
assume an estimated response rate of 90%–95%. That is to say, if a response rate of 95% is assumed,
then the sample size should be multiplied by
-
= 1/ 0.95. If there are reasons to believe
that the response rate will be low (e.g., if the planned number of attempts to reach selected
respondents is low, if the length of the survey questionnaire is long, or if there is known heavy migration
causing high rates of absenteeism), then it is best to assume a response rate that is closer to 90%.
However, in the absence of these conditions, Feed the Future recommends assuming an anticipated
response rate of 95% given the project staff’s established relationship with the participants.
This
adjustment is required for all survey design options (i.e., options 1, 2, and 3).
The final sample size (denoted by
), which is a product of the initial sample size and all three
adjustments (where applicable) then becomes:
=
-
9.2.4 Final Sample Size
The sample size is final after all necessary adjustments are made to the initial sample size (
).
Table 3 summarizes the adjustments to the initial sample size that need to be considered for each
survey design option.
Table 3. When to Use the Different Types of Adjustments
Adjustment
Type of adjustment
Survey design
option 1
Survey design
option 2
Survey design
option 3
1
Finite Population Correction
(if
0.05 )
2 Design Effect Due to Clustering
3
Anticipated Individual
Non-Response
The fo
rmulas for the final sample size for each survey design option are given in Table 4. Note that for
the third survey design option,
is not needed. Also note that it is important that the
finite population correction be carried out first; the other two corrections are interchangeable in terms
of order.

Participant-Based Survey Sampling Guide for Feed the Future Annual Monitoring Indicators 47
Table 4. Final Sample Size Formulas for the Three Survey Design Options
Option Survey design Final sample size formula
1
Two-stage cluster design with
systematic selection of
participants
=
-
2
Two-stage cluster design with a
listing operation and systematic
selection of participants
=
-
3
One-stage design with systematic
selection of participants
=
-
The illustrative example provided earlier for the “Number of Hectares under Improved Management
Practices” indicator is continued as an illustration to demonstrate the use of the three adjustments, and
the results are given in the table on the next page.
Fo
r the first adjustment, the finite population correction is not necessary because the initial sample size
(
= 171) comprises only 0.3% of the participant population size (N = 60,000). Therefore, the initial
sample size of 171 remains unchanged.
For the second adjustment, it is assumed that it is the first year that the IP is conducting a PaBS and that
there is no external information on the design effect from previous similar surveys. Therefore, for the
purposes of the sample size calculation, an estimated design effect of 2 is specified. This adjustment due
to the design effect then doubles the initial sample size from 171 to 342.
Fo
r the third and final adjustment, there is no external information on the non-response rates available
from previous similar surveys. Therefore, for the purposes of the sample size calculation, an anticipated
response rate of 95% is specified. The multiplicative adjustment due to non-response then increases the
sample size to 360, which is the final sample size (
). Note that if the final sample size is a fraction,
it is necessary to round up to the next nearest integer to obtain a final resultant figure, as indicated in
the final row of the example.

Participant-Based Survey Sampling Guide for Feed the Future Annual Monitoring Indicators 48
SURVEY DESIGN
OPTION
INDICATOR
Indicator title:
INITIAL SAMPLE SIZE
N
Population of participants 60,000
participants
Estimate of standard deviation available? NO
If YES, write estimate here: 10.00 units of indicator
If NO, provide best estimates of indicator
max
Estimate of maximum (per participant)
4.00
hectares
min
Estimate of minimum (per participant) 0.00
hectares
s
Standard deviation 0.667
= (4 - 0) / 6
p
Margin of error (acceptable percentage error) 10%
p=.10
Margin of error (target value of indicator)
60,000
MOE
Margin of error 6,000
= 0.10 x 60,000
Confidence level 95%
z
Critical value from Normal Probability Distribution 1.96
n
initial
Initial sample size 171
ADJUSTMENT 1
Use adjustment 1? (if survey designs 1,2,3 and
if initial sample size ≥ 5% of population size)
NO
n
initial
/ N
% sample of survey population 0.3%
Adjusted sample size (1) 171
ADJUSTMENT 2
Use adjustment 2? (survey designs 1,2) YES
Design effect Design effect 2.00
Adjusted sample size (1,2) 342
= 171 x 2
ADJUSTMENT 3
Use adjustment 3? (s urvey des igns 1,2,3)
YES
Non-response Non-response rate 5%
Adjusted sample size (1,2,3) 360
= 342/(1 - 0.05) = 342/0.95
FINAL SAMPLE SIZE
n
final
Final sample size 360
= roundup(360)
1 - Two-stage cluster desi gn wi th systemati c selecti on of partici pants
1 - Number of hectares under improved management practices or technologies with USG assistance
Finite population
correction
=
60,000
× 0.667
× 1.96
6,000

Participant-Based Survey Sampling Guide for Feed the Future Annual Monitoring Indicators 49
9.2.5 Determining the Overall Sample Size for the Survey
As mentioned earlier, to arrive at an overall sample size for the survey, the general recommended
practice is to calculate the final sample size for all candidate agriculture-related indicators outlined in
Section 9.2.2 and then to choose the largest sample size from among those computed. It is very
important that survey practitioners budget sufficiently so that they are able to support data collection
associated with the largest sample size generated from among the key indicators. If a smaller than
optimal sample size is used for the survey, the precision of some of the annual monitoring indicators for
which estimates are desired will suffer.
In reference to the recommended agriculture-related indicators on which to base the overall sample size
(outlined in Section 9.2.2), a special adaptation has been made in relation to the “Yield of Agricultural
Commodities” indicator. Because this indicator must be reported at the level of agricultural commodity
(rather than at the overall level), a sample size computation for the indicator must be performed
separately for each of the three commodities considered most important (i.e., most widely cultivated or
raised).
Note that the computation of estimates of “Yield of Agricultural Commodities” for each commodity type
uses only part of the sample of participants that comes from the portion of the overall sampling frame
relating to the specific commodity in question. Because not all participants necessarily produce all
commodities promoted by the project, the sample generating the commodity-specific yield indicators
may not be based on a representative sample of the entire frame of participants.
45
As such, because the overall sample size is randomly drawn from the entire frame of participants with
no specified sample allocation to each part of the frame (i.e., sub-frame) relating to the participants
associated with the three yield indicators, the sample size realized for the three yield indicators cannot
be predicted in advance. Therefore, it is not possible to predict the exact precision that will be
associated with the estimates of each of the three yield indicators. While a specific allocation of the
overall sample size to the three sub-frames is possible in principle, it is extremely complex to enact given
the potential for the multiple pairwise overlap of participants in relation to the three commodity types.
Therefore, such an allocation scheme is considered beyond the scope of this guide.
Given the above constraint, as a strategy for computing the overall sample size for the survey, Feed the
Future recommends that survey implementers sum the sample size requirements for the three yield
indicators (indicators 4, 5, and 6 in Section 9.2.2), to increase the overall sample size for the survey, and
therefore to increase the chance that a sufficiently large number of participants engaged in producing
each commodity is randomly selected to meet the precision requirements for each of the three yield
indicators.
Next, survey implementers should compare the sum of the sample sizes from the three yield indicators
to the sample sizes required for indicators 1, 2, and 3 individually, and then choose the largest sample
size from among the four quantities as the final sample size for the survey.
45
It is also possible that the portion of the sampling frame that includes participants producing any of the three commodities
does not cover the entire frame and therefore does not constitute a complete frame of participants. This is because there may
be more than three commodities promoted by the project, and there may be participants who are producing one or more of
the other commodities promoted by the project, but not any of the three key commodities.

Participant-Based Survey Sampling Guide for Feed the Future Annual Monitoring Indicators 50
In the example below, the final sample size has been calculated for six candidate indicators. First, the
sample size is computed for the three indicators of totals: “Number of Hectares under Improved
Management Practices,” “Value of Sales,” and “Number of Individuals Using Improved Management
Practices,” using a variety of input parameter values. The resulting sample sizes are 360, 517, and 809,
respectively. Then, the sample size is computed for the three yield indicators (using the formula for
means found in Annex 4): “Yield of Agricultural Commodity – Coffee,” “Yield of Agricultural Commodity
– Beans,” and “Yield of Agricultural Commodity – Maize.” The resulting sample sizes are 221, 272, and
198, respectively; these are then added together, summing to 691.
In the example below, it is clear that the largest sample size among the values 360, 517, 809, and 691 is
809 participants, corresponding to the “Number of Individuals Using Improved Management Practices”
indicator. Therefore, the final overall sample size for the survey will be fixed at
= 809. This means
that the PaBS will randomly select and conduct interviews on 809 participants for all agricultural annual
monitoring indicators. Because the largest sample size is chosen as the overall sample size for the
survey, it will meet (and in fact exceed) the needs of the indicators “Number of Hectares under
Improved Management Practices” and “Value of Sales.” On the other hand, this same sample size may
or may not meet the needs of the indicators “Yield of Agricultural Commodity – Coffee,” “Yield of
Agricultural Commodity – Beans,” and “Yield of Agricultural Commodity – Maize.” This is because there
may be fewer than 221, 272 and 198 participants growing coffee, beans and maize, respectively, from
among the 809 participants that are sampled overall.
It is also interesting to note from the example below that the population of participants for each of the
three yield indicators (i.e., 30,000, 20,000, and 40,000, respectively, from the third column) is less than
the overall population of participants (i.e., 60,000) implied by the other three indicators; this is
indicative of the fact that not all participants included on the sampling frame produce at least one of the
three key commodities. Furthermore, the sum of the three population values across the three
commodities (i.e., 90,000) exceeds the overall population of participants (i.e., 60,000), which is
indicative that there is overlap in the participants engaged in producing the three commodities because
some participants produce more than one of the key commodities.

Participant-Based Survey Sampling Guide for Feed the Future Annual Monitoring Indicators 51
N max min s p MOE z
n
initial
n
final
INDICATOR
Type of
Indicator
Population of
participants
Estimate of
maximum
(for s)
Estimate of
minimum
(for s)
Standard
deviation
Acceptable
percentage
error
(for MOE)
Target value of
indicator
(for MOE)
Margin of
Error
Critical
Value
Initial
Sample
Size
Finite
Population
Correction
n
e
eded?
Design
effect
Non
response
rate
Final
sample
size
1 - Number of hectares under
improved management practices
Total 60,000 4 0 0.67 10% 60,000 6,000 1.96 171 No 2.00 5% 360
2 - Value of sales Total 60,000 1,200 0 200.00 10% 15,000,000 1,500,000 1.96 246 No 2.00 5% 517
3 - Number of individuals using
improved management practices
Total 60,000 - - 0.50
10% 30,000 3,000 1.96 385 No 2.00 5% 809
4 - Yield of Agricultural
Commodity - Coffee
Mean 30,000 - - 1,582.02 10% 2,627 263 1.96 140 No 1.51 5% 221
5 - Yield of Agricultural
Commodity - Beans
Mean 20,000
- - 1,911.37 10% 2,903 290 1.96 167 No 1.55 5% 272
6 - Yield of Agricultural
Commodity - Maize
Mean 40,000
- - 2,207.45 10% 4,184 418 1.96 107 No 1.75 5% 198
Sum of sample sizes for 3 "Yield of Agricultural Commodity" indicators 691
Participant-Based Survey Sampling Guide for Feed the Future Annual Monitoring Indicators 52
Note that Feed the Future requires that IPs produce estimates for the indicators above according to
specified disaggregates. The “Number of Hectares under Improved Management Practices” indicator
requires first-level disaggregated estimates by type of hectare (i.e., cropland, cultivated pasture,
aquaculture, rangeland, conservation area, freshwater or marine ecosystem, or other). The “Number of
Individuals Using Improved Management Practices” indicator requires a first-level disaggregated
estimate by value chain actor type (i.e., smallholder producer, non-smallholder producer, people in
government, people in private sector firms, people in civil society, and others). The “Value of Sales”
indicator requires a first-level disaggregated estimate by type of product or service. There are also
varying requirements for second-level disaggregated estimates (e.g., sex and age) that are nested within
first-level disaggregated estimates for all three indicators above. The “Value of Sales” indicator has an
additional requirement for third-level disaggregated estimates nested within the first two levels. The
“Yield of Agricultural Commodities” indicator requires reporting by commodity and requires second-
level disaggregated estimates by farm size (i.e., smallholder, non-smallholder), as well as third-level
disaggregated estimates by sex and age (i.e., 15–29 and 30+).
However, survey implementers should not produce estimates for required disaggregates based on
separate sample size calculations for those disaggregates. While it would be ideal to ensure precision for
the indicator estimate for a disaggregate at the same level as that for the overall estimate for the
indicator, this would entail a separate sample size calculation at the disaggregate level. Such a
calculation would mean taking into account the input parameters specific to disaggregates (e.g., the
total number of participants for the disaggregates and the target value of the indicator at the level of
the disaggregate population of participants).
More importantly, a sample size calculation for disaggregates separately could substantially increase the
overall sample size for the survey, making estimates at such levels of precision costly. For instance, in
the example above, for the “Number of Individuals Using Improved Management Practices” indicator,
assume there is only one first-level disaggregate by value chain actor type, say, smallholder producer.
Then, assuming the same input parameters as those used at the overall level, at the second level of
disaggregation, a separate sample size calculation for males and females would result in a requirement
of 809 sampled participants for each category of males and females, for a total sample size of 1,618
across both sexes. Increasing the overall sample size twofold (in this example) would drive up the cost of
the survey substantially. Therefore, survey implementers should not produce estimates of indicators by
their required disaggregates based on separate sample size calculations. Instead, they should compute
the estimates of disaggregated indicators based on the portion of the overall sample size that happens
to fall into the category of disaggregate, and accept the loss in precision. For instance, In the above
example, if we assume that the overall sample size for the survey is 809 of whom 500 respondents are
males and the remainder are females, then the disaggregated estimates by male and female should be
based on the reduced sample sizes of 500 and 309, respectively, even though there will be a loss in
precision for these estimates. However, IPs may decide that it is worth the additional investment of
resources to collect more precise sex-disaggregated data at some points in the project.
Finally, in light of the discussion above, Feed the Future recommends that IPs adopt a minimum overall
sample size for the survey of 525 participants. That is to say
should be 525 or more after taking
into account the three adjustments to
and assuming an anticipated response rate of 95%. If the
actual response rate encountered in the field is 95%, there will be completed interviews for 500 sampled

Participant-Based Survey Sampling Guide for Feed the Future Annual Monitoring Indicators 53
participants. In the example above, the final sample size for “Number of Hectares under Improved
Management Practices,” “Value of Sales,” “Number of Individuals Using Improved Management
Practices,” “Yield of Agricultural Commodity – Coffee,” “Yield of Agricultural Commodity – Beans,” and
“Yield of Agricultural Commodity – Maize” is 360, 517, 809, and 691, respectively (assuming the sum of
the three yield indicators for the last figure). If, instead, the final sample sizes had been 360, 517, 492,
and 450, respectively, then the Feed the Future recommendation would be to adopt a minimum overall
sample size for the survey of 525 participants (or 500 participants after taking into account non-
response).
A minimum final sample size of 525 (or 500 after non-response) participants is recommended based on
the need to:
• Ensure reasonable precision for Feed the Future-required disaggregates, given that each category
of disaggregate will have a sample size of less than 525 (or 500 after non-response)
• Ensure reasonable precision for district or other subproject-level geographic areas, should the IPs
wish to produce these for their own internal monitoring needs
In addition to setting a minimum final sample size, Feed the Future also recommends setting a
maximum final sample size for the survey of 2,000 participants (or 2,105 before non-response is taken
into account). Because survey implementers must sum the sample size for the three yield indicators as
part of the strategy for arriving at a final sample size for the survey, it is possible that this sum may
become prohibitively large (and in that case, would be the determining value for the overall sample size
for the survey). Therefore, survey implementers who have limited resources to conduct PaBSs are
permitted to cap the overall sample size to 2,000 participants. On the other hand, survey implementers
with sufficient resources may choose to accept larger final sample sizes for the PaBSs.
9.2.6 Updating Elements of the Sample Size Formula in Future Survey Rounds
The sample size calculation for PaBSs will most likely result in different sample sizes for different rounds
of the survey.
46
Several of the input parameters of the final sample size formula given earlier in the
guide (i.e., the initial sample size and the three adjustments) may be unknown, and therefore may need
to be estimated at the planning stages the first time a project conducts a PaBS for collecting data in
support of agriculture-related annual monitoring indicators. For subsequent rounds of surveys, these
input parameters can be directly computed from the survey data in the prior round. Such input
parameters include:
• Standard deviation
• Design effect for clustering
• Anticipated non-response rate
For the second round of PaBSs, values for these input parameters derived from the results of the first
survey round should be used. This will ensure a more accurate sample size calculation in the second
46
A “round” of PaBSs is defined as all PaBSs (one or more) that take place within 1 year. All surveys conducted within the same
year should use the same set of sampled participants over the various time points. Therefore, once a sample size is calculated
for the first survey in a year, the sample size remains the same for subsequent surveys within the same year or round. See
Section 7.3 for more details.

Participant-Based Survey Sampling Guide for Feed the Future Annual Monitoring Indicators 54
round. For the third round of PaBSs, values derived from the results of the second survey should be
used—and so forth until the end of the project.
Note also that the size of the survey population of participants (N) and the target values for the
indicators (used in the computation of MOE) are also likely to change from one survey round to the next,
given that project recruitment and graduation tends to be a dynamic process. Therefore, the updated
value of N and the target values for the indicators should be reflected in subsequent survey rounds for
the purposes of the sample size calculations.
9.3 Choosing the Number of Clusters to Select for Survey Design
Options 1 and 2 of the Household Survey Approach
After the sample size has been determined, the
next step in the survey design process for the
household survey approach is to choose the
number of clusters to be randomly selected at
the first stage of sampling and to determine how
much of the final sample size to allocate to each
of the clusters. This is relevant only to survey
design options 1 and 2 as only they employ a two-
stage cluster design.
In a two-stage sampling design with a given
sample size, there is no prescriptive formula for
determining how many clusters to choose and
how many participants to choose within each
cluster. There are competing interests in terms of
what is most operationally expedient versus what
is most statistically efficient.
On one hand, for operational expediency, it is
clearly optimal to select the smallest number of
clusters possible, with greater sample size per
cluster (assuming a given sample size). When a
smaller number of clusters is selected, the time for and cost of transportation to, from, and in between
the clusters are decreased—and potentially the number of interviewers can also be decreased.
However, the survey efficiency decreases, as measured by an increase in the design effect.
On the other hand, for statistical efficiency, it is recommended that the smallest number of participants
possible from each cluster be selected, and therefore that the largest number of clusters be selected, for
a given sample size. This is because each additional survey respondent within the same cluster adds a
decreasing amount of new information, assuming that clusters tend to be homogeneous in terms of the
characteristics of the participants who reside within.
Given these opposing considerations, a compromise must be struck, and the two considerations must be
balanced against each other.
Figure 3c. Steps in the Approach

Participant-Based Survey Sampling Guide for Feed the Future Annual Monitoring Indicators 55
To make an appropriate decision on the number of clusters and the number of participants to allocate
per cluster, the following attributes must be weighed against one another:
1. Adequate number of available interviewers
2. Available transportation and lodging options (in the event that interviewers have to stay
overnight in a sampled cluster)
3. Ease of access to all potential sampled clusters
4. Adequate budget
5. Reasonable time constraints
Possessing as many of the above attributes as possible translates into the ability to sample a greater
number of clusters to ensure greater statistical efficiency. However, each survey potentially faces a
different set of constraints, and it is not possible to provide a definitive recommended number of
clusters to select in each instance.
It is possible, however, to provide a rule of thumb concerning the number of sampled participants to
allocate to each sampled cluster. A range of 15–35 participants for each selected cluster is appropriate
because, in most cases, this represents a logistically feasible number of participants per cluster to
sample without inducing a very large design effect.
Based on this “15–35 participants per cluster” rule of thumb, one can then use the following approach
to decide on the actual number of clusters and participants per cluster to choose.
STEP 1. Divide the final sample size (
) by b, the minimum and maximum points of the rule of
thumb range (15 and 35, respectively), to obtain m, a range for the numbers of clusters to choose. The
resultant numbers of clusters, m, must be rounded up (because it is not possible to visit a fraction of a
cluster). The following is an example:
Final sample size n
final
809 participants
# participants per cluster to select b min = 15 max = 35
# clusters to select m = round(n
final
/ b) 54 24
Actual final sample size n
final
= b * m 810 840
In
this example, the final sample size calculated was
= 809 participants. The number of
participants that a data collection team could interview per cluster ranges from a minimum of 15 to a
maximum of 35 (according to the rule of thumb), while the number of clusters that correspond to
carrying out a minimum of 15 interviews per cluster and a maximum of 35 interviews per cluster is 54
and 24, respectively. The actual final sample size is computed by multiplying b by m. Note that the actual
final sample size achieved at the minimum and maximum endpoints of the range in the table above does
not correspond exactly to 809, due to the rounding that takes place in m.
STEP 2. Choose the largest number of clusters within the range for m (24–54 in the above example) that
best conforms to the logistical considerations listed earlier. For example, if the overall target sample size

Participant-Based Survey Sampling Guide for Feed the Future Annual Monitoring Indicators 56
is 809, it may be decided, using the table above and considering project constraints, that m = 40 clusters
should be chosen. This decision might be based on, for instance, the fact that the budget allows for
engaging eight survey teams to undertake interviewing in five clusters each, and it is deemed that the
survey work can be completed over a period of 5 weeks given the accessibility of the terrain in the area.
Surveying in m = 40 clusters means that
=
(
) = 21 participants per cluster will be
selected, for an overall actual final sample size of
= 840 (= 40 * 21).
STEP 3. Check to ensure that for the number of participants per cluster chosen, most (but not
necessarily all) clusters on the first stage cluster frame have at least the minimum required number of
participants. For instance, in the example in Step 2, most clusters on the first stage cluster frame need to
have at least 21 participants. If most clusters do not have a minimum of 21 participants, choose a
slightly larger number of clusters (m) and a slightly smaller number of participants (b) per cluster until
this criterion is met for most (but not necessarily all) clusters on the frame. Note that it may not be
worth adjusting the combination until the criterion is met for all clusters on the frame because a few
“outlier” clusters may require an adjustment of the combination of b and m that results in a very large
number of clusters (m) and a very small number of participants per cluster (b), which, in turn, would
generate logistical inefficiencies in the fieldwork. In such cases, it is preferable to live with the shortfall
of participants sampled in the particular outlier cluster, if that cluster happens to be selected in the
sample. This approach may lead to a slightly smaller overall sample size than the actual (or final)
projected sample size, but should not radically alter the precision of the survey results, particularly
considering that the expected sample size of 840 considerably exceeds the target sample size of 809.
There are a few issues to keep in mind when using this process.
1. For Step 1, the range of 15–35 participants (b) is a suggested rule of thumb, but not a rigid rule.
A smaller or greater number can be used in cases where it is appropriate (e.g., due to time or
budget constraints, or when it is foreseen that a greater or lesser number of interviews can be
completed by a team per day). However, it is advisable to avoid exceeding 35 participants per
cluster if possible, because a larger number of participants per cluster unduly drives up the
design effect of the survey and in turn compromises the precision of the estimates resulting
from the survey.
2. Because the recommendation is to round up the resulting value of b (Step 2), the actual final
sample size will always be somewhat larger than the original final sample size. However, this
increase in the sample size should not create a significant burden on the budget, and it should
be understood that additional sample always improves the precision of the survey results.

Participant-Based Survey Sampling Guide for Feed the Future Annual Monitoring Indicators 57
9.4 Selecting a Sample of Clusters for Survey Design Options 1 and 2
for the Household Survey Approach
After the number of clusters to be randomly
selected has been determined, the next step in the
survey design process for the household survey
approach is to randomly select a sample of clusters
from all the project implementation clusters. As a
reminder, this step is relevant only for survey
design options 1 and 2 because these two options
use a two-stage cluster design and this step
corresponds to the first stage of sampling.
In most instances, the method used to randomly
select a sample of clusters at the first stage of
sampling is called systematic probability-
proportional-to-size (PPS) sampling, or systematic
PPS sampling. In general, PPS sampling selects
clusters according to a “size measure” that is
related to the indicators of interest, which in the
case of the household survey approach is the total
number of project participants in each cluster.
Therefore, the minimum information that is
required for using systematic PPS sampling at the
first stage of sampling is a comprehensive list of clusters (i.e., villages or communities) in which
participants reside and a count of the number of participants in each cluster (to be used as a size
measure). If this sampling frame does not contain a count of the number of participants per cluster for
all of the clusters, it will not be possible to use systematic PPS sampling at the first stage, and an
alternative method called fractional interval systematic sampling may be used instead.
For survey design option 1, it is assumed that there is complete information on participants in each
cluster on the second stage participant frame and therefore that there is also complete size information
on the first stage cluster frame regarding the number of participants in each cluster. Therefore,
systematic PPS sampling can and should be used at the first stage of sampling in this case. However, for
survey design option 2, it is assumed that there is no up-to-date and comprehensive list of participants
within all implementation clusters served by the project (i.e., no second stage participant frame), and so
“size” information on a first stage cluster frame may or may not exist. Therefore, for survey design
option 2, either systematic PPS sampling or fractional interval systematic sampling should be used at the
first stage, depending on the available information on the first stage sampling frame.
9.4.1 Systematic PPS Sampling
The majority of surveys that use survey design options 1 and 2 will likely use systematic PPS sampling to
select the sample of clusters at the first stage of sampling, assuming that there is size information on the
first stage cluster frame.
Figure 3d. Steps in the Approach

Participant-Based Survey Sampling Guide for Feed the Future Annual Monitoring Indicators 58
In general, using PPS sampling ensures that clusters with a greater number of project participants have a
greater chance of being selected from the frame, while clusters with fewer project participants have a
smaller chance of being selected from the frame. It is an efficient way of sampling if the number of
participants per cluster varies greatly across all the clusters on the sampling frame.
47
Systematic PPS
sampling is a special variant of PPS sampling that is simpler to implement than other types of PPS
sampling.
The steps to select a sample of clusters using systematic PPS sampling are given below. The steps can be
carried out using any appropriate statistical software application. By way of example, the syntax
provided below is what would be used in Microsoft Excel.
STEP 1. Create a list of all clusters in the project implementation area. This is essentially the first stage
cluster frame described in Chapter 7. Information for each cluster on the list should include the
following:
• A unique ID number for the cluster
• The name of the cluster (e.g., village or community)
• The location of the cluster (census geography code, GPS coordinates, etc.)
• Information on all appropriate higher-level geographic areas (e.g., province or district)
• The number of project participants in the cluster
STEP 2. Order the list of clusters by a chosen geographic level. This can be done in any way, as long as
all clusters in one geographic area are next to each other in the list and the choice of geographic level by
which to order the clusters has relevance with respect to project implementation. For instance, if a Feed
the Future IP operates in distinct districts, then clusters should be grouped together by district.
The reason for ordering clusters geographically before systematic PPS selection of clusters is to achieve
“implicit stratification.” Implicit stratification increases the chances that at least some sampled clusters
fall in each of the geographic areas (e.g., districts, provinces, or departments) encompassed by the
project—although it is not guaranteed that all geographic areas will have even one sampled cluster.
Using implicit stratification ensures that more of the overall variability is captured in the sample.
Furthermore, it facilitates disaggregation of the results by geographic area because there will be some
(albeit an unplanned number of) sampled clusters in each (or at least in most) of the geographic areas.
48
STEP 3. Calculate a cumulative total number of participants. Create a new column on the first stage
cluster frame that contains a cumulative total number of participants per cluster. This column of
cumulative totals is used for selecting the sample of clusters. The first row of the cumulative total equals
the number of participants in the first cluster on the list. The second row of the cumulative total equals
47
Even if the number of participants per cluster does not vary greatly across clusters, it may still be useful to use PPS sampling
at the first stage as a way of ensuring a self-weighting design. If PPS sampling is used at the first stage sampling of clusters and
systematic sampling with an identical sample size of participants in each sampled cluster is used at the second stage of
sampling, then the overall sampling weights across the two stages can be shown to be constant or “self-weighting.”
48
Note that the disaggregated results will have a lower level of precision than the non-disaggregated results. This is because
each geographic area will have a smaller sample size than that of the total project area.

Participant-Based Survey Sampling Guide for Feed the Future Annual Monitoring Indicators 59
the number of participants in the second cluster plus the number from the first row. This pattern of
accumulation continues in the same way through to the end of the list. The following is an example.
In th
is example, the clusters are ordered by region (Central Region, Shattered Plains, and The North),
and the total number of participants across all clusters is 350 (which is the value in the last row of the
cumulative total column).
STEP 4. Calculate a sampling interval. The sampling interval (denoted by k) is calculated by dividing the
total number of participants in all implementation clusters (denoted by N in Section 9.2.2) by the
number of clusters to select (denoted by m), where the value of m is determined as per the instructions
in Section 9.3. For instance, if N = 350 and m = 4,
49
then the sampling interval is 87.5.
= =
()
()
49
Note that the value of N = 350 is artificially small because most IPs work with considerably more participants than that across
their entire project (i.e., in the tens of thousands or hundreds of thousands). Similarly, the value of m = 4 sampled clusters is
artificially small as many more clusters will likely need to be selected at the first stage of sampling to achieve a minimum
sample size of 525. The small numbers are used for illustration purposes only.

Participant-Based Survey Sampling Guide for Feed the Future Annual Monitoring Indicators 60
STEP 5. Calculate a random start. The random start (denoted by RS) determines the first cluster to
select. It is calculated by choosing a random number greater than or equal to 0 and less than 1 and
multiplying it by the sampling interval (k). The following is the formula to use to calculate the random
start:
= =
(
)
The Micr
osoft Excel function rand( ) generates a random (fractional) number greater than or equal to 0
and less than 1. To compute the random start RS, this random number is multiplied by the sampling
interval. For instance, if the sampling interval is 87.5 (from above) and the random number is 0.7146,
then the random start is RS = 0.7146 * 87.5 = 62.53.
STEP 6. Select the first cluster. The first cluster to select according to this scheme is the one that
corresponds to the value of the random start. To do this, identify the pair of consecutive clusters in the
list for which the cumulative total of participants in the first cluster is less than the random start and for
which the cumulative total of participants in the second cluster is greater than or equal to the random
start. Choose the second cluster in the pair. The following chart provides an example.
Total number of participants
(across all clusters)
N
350
List of all clusters
(ordered by region)
Number of clusters to select
m
4
Cl uster
number
Regi on Cluster name
Number of
participants
per cl us ter
Cumulative
total of
participants
Sampling interval
k = N/m
87.50 1
Central Region Kvothe 6 6
Random start
RS = rand()*k
62.53 2
Central Region Gumbo 13 19
3
Central Region Pancho 27 46
1ST CLUSTER TO SELECT
a
1
= RS
= 62.53 = 4 Central Region Glokta 22 68
62.53
62.53 is greater
than 46,
but less
than
68
In t
he example above, because the random start (62.53) is greater than 46 (the cumulative total of
participants in cluster 3) and less than 68 (the cumulative total of participants in cluster 4), cluster 4
(Glokta) is selected as the first cluster in the sample.
Note that if, by chance, rand( ) generates the number 0, then the random start is also 0. In this case,
simply choose the first cluster on the list to be the first cluster in the sample.
STEP 7. Select the second cluster. The second cluster to select for the sample is determined using the
following process. Compute a number a
2
that corresponds to the number obtained by adding the
sampling interval (k) to the random start (RS). Identify the pair of consecutive clusters in the list for
which the cumulative total of participants in the first cluster is less than a
2
and for which the cumulative
total of participants in the second cluster is greater than or equal to a
2
. Choose the second cluster in the
pair. The following chart provides an example.

Participant-Based Survey Sampling Guide for Feed the Future Annual Monitoring Indicators 61
Total number of participants
(across all clusters)
N
350
List of all clusters
(ordered by region)
Number of clusters to select
m
4
Cluster
number
Regi on Cluster name
Number of
participants
per cl us ter
Cumulative
total of
participants
Sampling interval
k = N/m
87.50 1
Central Region Kvothe 6 6
Random start
RS = ra nd()*k
62.53 2
Central Region Gumbo 13 19
3
Central Region Pancho 27 46
1ST CLUSTER TO SELECT
a
1
= RS
= 62.53 = 4 Central Region Glokta 22 68
5
Shattered Plains Rainbow's End 21 89
6
Shattered Plains Furculita 27 116
7
Shattered Plains Stanka 25 141
2ND CLUSTER TO SELECT
a
2
= RS+k
= 62.53 + 87.5 = 8 Shattered Plains Stormlight 26 167
62.53
150.03
62.53 is greater
than 46,
but less than
68
150.03 is greater
than 141,
but less than 167
In th
is example, the sampling interval (k = 87.5) is added to the random start (RS = 62.53) to obtain
a
2
= 150.03. Because a
2
= 150.03 is greater than 141 (the cumulative total of participants in cluster 7)
and less than 167 (the cumulative total of participants in cluster 8), cluster 8 (Stormlight) is selected as
the second cluster in the sample.
STEP 8. Select the third cluster. Create a number a
3
by adding twice the sampling interval (k) to the
random start (RS) to determine the third cluster to select for the sample. Use the resultant number in
exactly the same way as in Step 7 above. The following chart provides an example.
Total number of participants
(across all clusters)
N
350
List of all clusters
(ordered by region)
Number of clusters to select m
4
Clus ter
number
Region Cluster name
Number of
participants
per cl us ter
Cumulative
total of
participants
Sampling interval
k = N/m
87.50 1
Central Region Kvothe 6 6
Random start
RS = rand()*k
62.53 2
Central Region Gumbo 13 19
3
Central Region Pancho 27 46
1ST CLUSTER TO SELECT
a
1
= RS
= 62.53 = 4 Central Region Glokta 22 68
5
Shattered Plains Rainbow's End 21 89
6
Shattered Plains Furculita 27 116
7
Shattered Plains Stanka 25 141
2ND CLUSTER TO SELECT
a
2
= RS+k
= 62.53 + 87.5 = 8 Shattered Plains Stormlight 26 167
9
Shattered Plains Deepness 26 193
10
The North Black Dow 9 202
11
The North Logan 12 214
3RD CLUSTER TO SELECT
a
3
= RS+2*k
= 62.53 + (2 * 87.5) =
12
The North Tul Duru 33 247
62.53
237.53
62.53 is greater
than 46,
but less
than 68
150.03 is greater
than 141,
but less than 167
237.53 is greater
than 214,
but less than 247
150.03
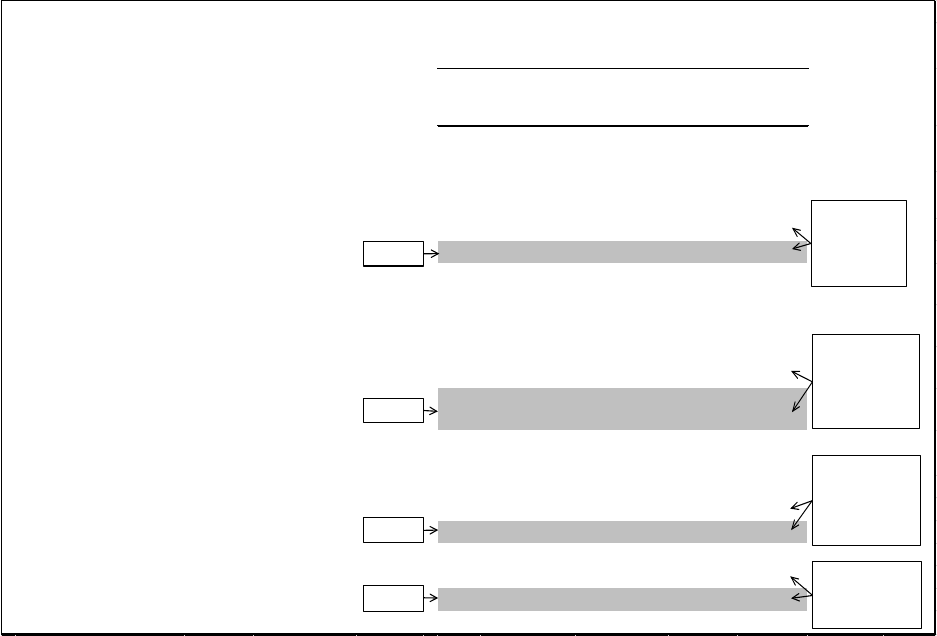
Participant-Based Survey Sampling Guide for Feed the Future Annual Monitoring Indicators 62
In this example, twice the sampling interval (2 * k = 2 * 87.5 = 175) is added to the random start
(RS = 62.53) to obtain a
3
= 237.53. Because a
3
= 237.53 is greater than 214 (the cumulative total of
participants in cluster 11) and less than 247 (the cumulative total of participants in cluster 12), cluster 12
(Tul Duru) is selected as the third cluster in the sample.
STEP 9. Continue in a similar fashion until the number of clusters (m) is reached. The following chart
provides the final result of the selection.
Total number of participants
(across all clusters)
N
350
List of all clusters
(ordered by region)
Number of clusters to select
m
4
Cluster
number
Region Cluster name
Number of
participants
per cl uster
Cumulative
total of
participants
Sampling interval
k = N/m
87.50 1
Central Region Kvothe 6 6
Random start
RS = ra nd()*k
62.53 2
Central Region Gumbo 13 19
3
Central Region Pancho 27 46
1ST CLUSTER TO SELECT
a
1
= RS
= 62.53 = 4 Central Region Glokta 22 68
5
Shattered Plains Rainbow's End 21 89
6
Shattered Plains Furculita 27 116
7
Shattered Plains Stanka 25 141
2ND CLUSTER TO SELECT
a
2
= RS+k
= 62.53 + 87.5 = 8 Shattered Plains Stormlight 26 167
9
Shattered Plains Deepness 26 193
10
The North Black Dow 9 202
11
The North Logan 12 214
3RD CLUSTER TO SELECT
a
3
= RS+2*k
= 62.53 + (2 * 87.5) =
12
The North Tul Duru 33 247
13
The North Bast 34 281
14
The North Kaladin 34 315
4TH CLUSTER TO SELECT
a
4
= RS+3*k
= 62.53 + (3 * 87.5) =
15
The North Arya 35 350
62.53
150.03
237.53
325.03
62.53 is greater
than 46,
but less than 68
150.03 is greater
than 141,
but less than
167
237.53 is greater
than 214,
but less than
247
325.03 is greater
than 315,
but less than 350
In this example, three times the sampling interval (3 * k = 3 * 87.5 = 262.5) is added to the random start
(RS = 62.53), resulting in 325.03. Because 325.03 is greater than 315 (the cumulative total of participants
in cluster 14) and less than 350 (the cumulative total of participants in cluster 15), cluster 15 (Arya) is
selected as the fourth and last cluster in the sample.
Also note in the example above that using implicit stratification (i.e., by ordering the clusters by region)
resulted in a sample that was spread out across all regions (Central Region, Shattered Plains, and The
North). As noted in Step 2, by ordering the clusters prior to sampling, it is more likely to obtain a sample
of clusters with at least one cluster chosen in each region.
Finally, it is also important to note that it is possible and acceptable to select the same cluster more than
once using systematic PPS sampling. This can happen if the number of participants in a particular cluster
is very large and the sampling interval is relatively small (e.g., less than half the number of participants in

Participant-Based Survey Sampling Guide for Feed the Future Annual Monitoring Indicators 63
the cluster). The treatment of this situation will be dealt with at the second stage of sampling, which is
discussed in Section 9.5.4.
9.4.2 Fractional Interval Systematic Sampling
A second method of sample selection that can be used at the first stage for selection of clusters is called
fractional interval systematic sampling. This method is applicable for survey design option 2 in the case
where the first stage cluster frame does not contain a count of the number of participants in each
cluster. In this instance, it is not possible to implement systematic PPS sampling. Fractional interval
systematic sampling does not use size measures, but instead assigns each cluster an equal probability of
being selected.
The steps to apply fractional interval systematic sampling are similar to those used for systematic PPS
sampling, although there are some nuanced differences. As with systematic PPS sampling, the steps can
be carried out using any appropriate statistical software application. By way of example, the syntax
provided here is what would be used in Microsoft Excel.
STEP 1. Create a list of all clusters in the project implementation area. This is essentially the first stage
cluster frame described in Chapter 7, although it is not necessary to have information on the number of
project participants in each cluster. However, information for each cluster on the list should include the
following:
• A unique ID number for the cluster
• The name of the cluster (e.g., village or community)
• The location of the cluster (census geography, GPS coordinates, etc.)
• Information on all appropriate higher-level geographic areas (e.g., province or district)
STEP 2. Order the list by a chosen geographic area. This can be done in any way, as long as all clusters
in one geographic area are next to each other in the list.
STEP 3. Calculate a sampling interval. The sampling interval is calculated by dividing the total number
of clusters in the project implementation area on the sampling frame (M) by the number of clusters to
select (m), where the value of m is determined according to the instructions in Section 9.3. For instance,
if M = 15 and m = 4, then the sampling interval is 3.75.
= =
()
()
STEP 4. Calculate a random start. The random start determines the first cluster to select. It is calculated
by choosing a random number greater than or equal to 0 and less than 1 and multiplying the result by
the sampling interval. The following is the formula to use to calculate the random start:
= =
(
)
The Microsoft Excel function rand( ) generates a fractional random number greater than or equal to 0
and less than 1. To compute the random start (RS), multiply this random number by the sampling

Participant-Based Survey Sampling Guide for Feed the Future Annual Monitoring Indicators 64
interval (k). For instance, if the sampling interval is k = 3.75 (from above) and the random number
generated is rand( ) = 0.3146, the random start will be RS = 0.3146 * 3.75 = 1.18.
STEP 5. Select the first cluster. The first cluster to select according to this scheme is the one whose
cluster number corresponds to the random start (RS) rounded up to the nearest integer. The following
chart provides an example.
Total number of clusters on frame
M
15
Number of clusters to select
m
4
Sampling interval
k = M/m
3.75
Random start
RS = rand()*k
1.18
Round up
Cluster
number
Regi on Cluster name
1
Central Region Kvothe
1ST CLUSTER TO SELECT
a
1
= RS
= 1.18 = 1 Central Region Gumbo
List of all clusters
(ordered by region)
2
2
1.18
In t
he example above, the random start is RS = 1.18 and it is rounded up to 2. Therefore, cluster 2
(Gumbo) is selected as the first cluster in the sample.
Note that if, by chance, rand( ) generates the number 0, then the random start is also 0. In this case,
choose the first cluster on the list to be the first cluster in the sample.
STEP 6. Select the second cluster. The second cluster to select according to this scheme is the one
whose cluster number corresponds to the number formed by adding the sampling interval k (including
the integer part and all decimals) to the random start RS (including the integer part and all decimals),
rounded up to the nearest integer. The following chart provides an example.
Total number of clusters on frame
M
15
Number of clusters to select
m
4
Sampling interval
k = M/m
3.75
Random start
RS = ra nd()*k
1.18
Round up
Clus ter
number
Regi on Cluster name
1
Central Region Kvothe
1ST CLUSTER TO SELECT
a
1
= RS
= 1.18 = 1 Central Region Gumbo
3
Central Region Pancho
4
Central Region Glokta
2ND CLUSTER TO SELECT
a
2
= RS+k
= 1.18 + 3.75 = 4 Shattered Plains Rainbow's End
List of all clusters
(ordered by region)
2
2
1.18
4.93
5
5
In t
his example, the sampling interval (k = 3.75) is added to the random start (RS = 1.18) to obtain 4.93.
This is rounded up to 5, and therefore cluster 5 (Rainbow’s End) is selected as the second cluster in the
sample.

Participant-Based Survey Sampling Guide for Feed the Future Annual Monitoring Indicators 65
STEP 7. Select the third cluster. Add twice the sampling interval (k) to the random start (RS) to
determine the third cluster to select for the sample. Use the resultant number in exactly the same way
as in Step 6 above. The following chart provides an example.
Total number of clusters on frame
M
15
Number of clusters to select
m
4
Sampling interval
k = M/m
3.75
Random start
RS = rand()*k
1.18
Round up
Clus ter
number
Regi on Cluster name
1
Central Region Kvothe
1ST CLUSTER TO SELECT a
1
= RS = 1.18 = 1 Central Region Gumbo
3
Central Region Pancho
4
Central Region Glokta
2ND CLUSTER TO SELECT
a
2
= RS+k = 1.18 + 3.75 = 4 Shattered Plains Rainbow's End
6
Shattered Plains Furculita
7
Shattered Plains Stanka
8
Shattered Plains Stormlight
3RD CLUSTER TO SELECT
a
3
= RS+2*k
= 1.18 + (2 * 3.75) = 8 Shattered Plains Deepness
List of all clusters
(ordered by region)
2
2
1.18
4.93
5
5
8.68
9
9
In t
his example, twice the sampling interval (2 * k = 2 * 3.75 = 7.5) is added to the random start
(RS = 1.18) to obtain 8.68. This is rounded up to 9, and therefore cluster 9 (Deepness) is selected as the
third cluster in the sample.

Participant-Based Survey Sampling Guide for Feed the Future Annual Monitoring Indicators 66
STEP 8. Continue in a similar fashion until the total number of clusters (m) to select is reached. The
following chart provides the final result of the selection.
Total number of clusters on frame
M
15
Number of clusters to select
m
4
Sampling interval
k = M/m
3.75
Random start
RS = rand()*k
1.18
Round up
Clus ter
number
Regi on Cluster name
1
Central Region Kvothe
1ST CLUSTER TO SELECT
a
1
= RS
= 1.18 = 1 Central Region Gumbo
3
Central Region Pancho
4
Central Region Glokta
2ND CLUSTER TO SELECT
a
2
= RS+k
= 1.18 + 3.75 = 4 Shattered Plains Rainbow's End
6
Shattered Plains Furculita
7
Shattered Plains Stanka
8
Shattered Plains Stormlight
3RD CLUSTER TO SELECT
a
3
= RS+2*k
= 1.18 + (2 * 3.75) = 8 Shattered Plains Deepness
10
The North Black Dow
11
The North Logan
12
The North Tul Duru
4TH CLUSTER TO SELECT
a
4
= RS+3*k
= 1.18 + (3 * 3.75) = 12 The North Bast
14
The North Kaladin
15
The North Arya
List of all clusters
(ordered by region)
2
2
1.18
4.93
5
5
8.68
9
9
12.43
13
13
In t
his example, three times the sampling interval (3 * k = 3 * 3.75 = 11.25) is added to the random start
(RS = 1.18) to obtain 12.43. This is rounded up to 13, and therefore cluster 13 (Bast) is selected as the
fourth and last cluster in the sample.
Note in the example above that, once again, using implicit stratification (i.e., by ordering the clusters by
region) resulted in a sample that was spread out across all regions (Central Region, Shattered Plains, and
The North), although even with ordering, it is still possible to have one or more regions with no clusters
chosen.
Finally, note that with fractional interval systematic sampling, it is not possible to select the same cluster
more than once, unlike with systematic PPS sampling (unless the number of clusters to select, m,
exceeds the total number of clusters on the frame, M, which does not happen in practice).

Participant-Based Survey Sampling Guide for Feed the Future Annual Monitoring Indicators 67
9.5 Selecting the Survey Respondents for All Survey Design Options
for the Household Survey Approach
The final step in the survey design process for the
household survey approach is to randomly select
the survey respondents to interview. The final step
is relevant for all survey design options (1, 2, and
3), and it corresponds to the second stage of
sampling for survey design options 1 and 2 and the
first stage of sampling for survey option 3.
The process of selecting respondents is
implemented by selecting participants from a list
using one of two variants of an equal probability
method: selecting survey respondents before
fieldwork using fractional interval systematic
sampling or selecting survey respondents in the
field using systematic sampling. The former is
appropriate for survey design options 1 and 3,
while the latter is appropriate for survey design
option 2.
For all three survey design options, before survey
respondents can be selected using one of the two
variants, a comprehensive list of participants must
be constructed, whether through participant registration systems before fieldwork begins (survey design
options 1 and 3) or through a listing operation during fieldwork (survey design option 2).
9.5.1 Selecting Survey Respondents before Fieldwork Using Fractional Interval
Systematic Sampling (for Survey Design Options 1 and 3)
Survey design option 1 entails two stages of sampling, where clusters are selected at the first stage of
sampling using the methods described in Section 9.4. For the second stage of sampling of survey
respondents, a comprehensive list of participants is needed from which to sample—but only for the
clusters that are selected at the first stage. That means that for every cluster that is selected at the first
stage, a complete list of participants in that cluster is required for the second stage of sampling before
fieldwork begins.
In contrast, survey design option 3 entails only one stage of sampling, where survey respondents are
directly sampled from the frame of participants, without regard to clusters. In this case, a
comprehensive list of all participants is required before fieldwork begins. Although the selection of
participants from the list is undertaken without regard to clustering, survey implementers should order
the list of participants by implementation villages/communities prior to sampling, so that the systematic
selection of respondents will be spread across implementation villages/communities.
For both survey design options 1 and 3, no listing exercise is needed, because it is assumed that a
comprehensive list or frame of participants already exists.
Figure 3e. Steps in the Approach

Participant-Based Survey Sampling Guide for Feed the Future Annual Monitoring Indicators 68
Randomly selecting participants from the sampling frame using fractional interval systematic sampling
uses the same method described in the previous section for the selection of clusters at the first stage of
sampling. The main difference is that, at the second stage, participants rather than clusters are selected.
For instance, for survey design option 1, the same steps described in Section 9.4.2 should be followed,
but using the list of project participants for each cluster and the following formula for the sampling
interval:
= =
()
()
where b, the number of participants to select in each cluster, is determined following the instructions in
Section 9.3, and B, the total number of participants in the cluster, is determined using a count from the
second stage participant frame.
Note that for survey design option 1, a separate sampling interval needs to be calculated for each
sampled cluster in the survey. An example of fractional interval systematic sampling for selecting from a
list frame of participants assuming survey design option 1 is given next.

Participant-Based Survey Sampling Guide for Feed the Future Annual Monitoring Indicators 69
Number of participants in cluster
B
22
Number of participants per cluster to select
b
8
Sampling interval
k = B/b
2.75
Random start
RS = rand()*k
1.77
Round up
1ST PARTICIPANT TO SELECT
b
1
= RS
1.77 2 1 L. Popescu
2ND PARTICIPANT TO SELECT
b
2
= RS+k
4.52 5 2 G. Grafiti
b
3
= RS+2*k
7.27 8 3 J.J. Abramov
b
4
= RS+3*k
10.02 11 4 K. Blessed
b
5
= RS+4*k
12.77 13 5 G. Smithy
b
6
= RS+5*k
15.52 16 6 B.B. Gigi
b
7
= RS+6*k
18.27 19 7 C. Shmaltz
8TH PARTICIPANT TO SELECT
b
8
= RS+7*k
21.02 22 8 Ch. Shaltitch
9 Sh. Choopah
10 B. Jobonei
11 W. Zebreeks
12 Th. Stankulets
13 V. Augustus
14 E. Starck
15 D. Targanovitch
16 R. Hornshnutz
17 P.O. Buxitz
18 Fh. Furbenty
19 Du. Poonts
20 R. Shteingartz
21 Q. Berts
22 M.N. Shevitz
List of participants
in cluster
For survey design option 3, the following formula should be used for the sampling interval:
= =
()
()
Sampling is done in a manner very similar to the example above, except selection of participants is
performed across clusters, not within each sampled cluster. Therefore, only one sampling interval is
required for the entire operation.
Participant-Based Survey Sampling Guide for Feed the Future Annual Monitoring Indicators 70
9.5.2 Listing Operation in the Field (for Survey Design Option 2)
For survey option 2, because no second stage list frame of project participants exists, the frame must be
created in the field for every sampled cluster through a listing operation. After the frame is created,
survey participants are then randomly selected while in the field using systematic sampling (described in
the next section). This section describes the listing operation.
Listing operations occur only in the clusters randomly selected in the first stage of sampling for survey
design option 2. Listing is a separate activity that takes place before survey respondents are selected
and interviewing starts. In general, a listing operation is implemented by having interviewers visit every
household in a cluster, ascertain whether or not the household has project participants, and stop only at
households that include project participants to collect basic information on each project participant in
the household. If there are no project participants in a particular household, then no information is
collected from that household. If there are multiple project participants in a given household,
information on each of them is collected.
It is important to collect information on the location of participant households within sampled clusters,
so that interviewers can potentially return at a later time to conduct interviews with the participants
who reside within these clusters if they are randomly selected. GPS coordinates of households can also
be taken and the coordinates can be recorded as part of the information on each participant.
As listing progresses through the cluster, each newly identified participant is added to a list, and, thus, a
second stage frame of participants in each sampled cluster is dynamically created in the field. It is critical
that all households in the cluster be visited to ensure that all project participants in the cluster are
identified—so that the resultant list frame is as complete as possible.
The information to be included is the same as that required for the second type of sampling frame
described in Chapter 7:
• Unique participant ID number
• Participant’s complete name
• Participant’s age and sex
• Participant’s household location (e.g., address or relative location, GPS coordinates)
• Village name/community name to which the participant belongs
• Location of the village/community (e.g., census geographic code or GPS coordinates, if available)
• Any higher geographic levels (e.g., province or district) in which the participant resides
Additional information that should be included (if feasible and affordable) is outlined in Section 7.1.
Listing operations represent additional time and expense, and, as a result, survey design option 2 is
more resource-intensive than survey design option 1, which does not include a listing operation. In most
cases, a listing operation in a cluster lasts no more than a day or two, although this depends on the
cluster size, the terrain, and any potential access issues. Given this additional burden, projects are
encouraged to develop and maintain high-quality participant registration systems that will help

Participant-Based Survey Sampling Guide for Feed the Future Annual Monitoring Indicators 71
eliminate the need for the listing operations—and that will allow projects to use survey design option 1
in subsequent surveys instead.
9.5.3 Selecting Survey Respondents in the Field Using Systematic Sampling (for
Survey Design Option 2)
For survey design option 2, once the listing operation has been completed, survey respondents are then
selected in the field using a method called systematic sampling. This method is similar to fractional
interval systematic sampling used for selecting participants before fieldwork described in Section 9.5.1
for survey design options 1 and 3. The main differences between the two methods are the following two
simplifications:
1. The sampling interval is rounded (either up or down) to the closest integer.
2. The random start is an integer (rather than a fractional number) greater than or equal to 1 and
less than or equal to the rounded sampling interval, and a different Microsoft Excel function
from the one given for fractional interval systematic sampling is used in its computation.
In this case, the rounded sampling interval, k
rounded
, is calculated as:
(
) = k
rounded
=
(
, 0
)
where:
=
(
)
(
)
and where the Microsoft Excel function round(k,0) rounds the number k up or down to the nearest
integer.
The random start is computed as:
=
=
(
1,k
rounded
)
where the Microsoft Excel function randbetween(1,k
rounded
) generates a random integer (i.e., a discrete
value) greater than or equal to 1 and less than or equal to k
rounded
.
The above changes are made to the original fractional interval systematic sampling method to simplify
the process of selecting participants for field staff, given that selection occurs in the field immediately
following listing, and once the number of participants in the listed clusters is ascertained. Sampling
intervals and random starts without decimals make it easier for field staff to undertake the
computations required to identify the correct participants to interview.
This simplification does, however, add some uncertainty around the total number of participants that is
ultimately selected for interviewing in each cluster. This is explained in more detail using the example
below. Note that the example refers to sampling within one sampled cluster only. The same procedure
needs to be repeated for each sampled cluster in the survey.

Participant-Based Survey Sampling Guide for Feed the Future Annual Monitoring Indicators 72
Number of participants in cluster
B
25
Number of participants to select in each cluster
b
8
Sampling interval
k = B/b
3.13
Sampling interval (rounded)
k
rounded
= round(k,0)
3
Sample 1
Sample 2 Sample 3
Random start
RS =
randbetween(1,k
rounded
)
1 2 3
Participant
number
Participant
number
Participant
number
1ST PARTICIPANT TO SELECT
b
1
= RS 1 2 3
2ND PARTICIPANT TO SELECT b
2
= RS+k
rounded
4 5 6
b
3
= RS+2*k
rounded
7 8 9
b
4
= RS+3*k
rounded
10 11 12
b
5
= RS+4*k
rounded
13 14 15
b
6
= RS+5*k
rounded
16 17 18
b
7
= RS+6*k
rounded
19 20 21
8TH PARTICIPANT TO SELECT b
8
= RS+7*k
rounded
22 23 24
b
9
= RS+8*k
rounded
25
9 8 8
Number of participants selected:
In
the above example, the sampling interval k = B / b = 3.13 is rounded to the nearest integer, which is
k
rounded
= 3. An integer random start, RS, between 1 and 3 is generated. For illustration purposes, all
three possible random starts (1, 2, and 3) are shown in separate columns, as are the three different
samples generated based on these random starts. The first sample consists of nine participants labeled
1, 4, 7, 10, 13, 16, 19, 22, and 25. The second sample consists of eight participants labeled 2, 5, 8, 11, 14,
17, 20, and 23. Finally, the third sample also consists of eight participants labeled 3, 6, 9, 12, 15, 18, 21,
and 24. This example illustrates the fact that the actual number of participants selected through

Participant-Based Survey Sampling Guide for Feed the Future Annual Monitoring Indicators 73
systematic sampling in a given cluster will not always be the targeted number (in this case, eight).
50
This
is due to the rounding of the sampling interval that is used as a simplification to the more standard
fractional interval systematic sampling.
In the case of Sample 1 above where nine participants are selected instead of the targeted eight, it is
important to interview all nine participants and not stop after eight interviews. Stopping short will result
in a sample where some of the participants have a zero probability of being selected. In probability-
based sampling, all selection units must have a non-zero probability of being selected.
Note that if the number of participants to be selected in the cluster equals or exceeds the number of
participants in the cluster (i.e., b ≥ B), then there is no need to undertake the above computation, and in
this case, all participants in the cluster should be selected even though there may be a shortfall in the
sample size for that cluster.
9.5.4 Considerations to Take into Account When Selecting the Survey Respondent
1. For both fractional interval systematic sampling and systematic sampling, there should be no
substitutions of sampled participants with replacement participants when collecting data in the
field. For example, if the first sample is chosen in the example above using systematic sampling,
then participants 1, 4, 7, 10, 13, 16, 19, 22, and 25 must be located (using the information from the
second stage participant frame created through listing) and must be interviewed. If a selected
participant is not present or chooses not to respond, survey implementers should not visit one of
the other participants on the sampling frame that was not part of the selected sample as a
substitute. If a participant is not available for interviewing, the interviewer should revisit the
household up to three times to secure an interview. If, after three attempts, an interview still cannot
be secured, then the participant should be labeled as a “non-respondent” and sample weight
adjustments must be made after fieldwork to compensate for the data relating to the missing
respondent. Recall that when the sample size was calculated, the initial sample size was inflated to
compensate for anticipated individual non-response, i.e., to compensate for the fact that not all
interviews in the field would be secured as planned.
2. For systematic sampling only, it is possible that the total number of survey respondents will not be
achieved, and that more (or fewer) participants will be interviewed in the survey than originally
planned. This is illustrated in the example above, where eight participants were targeted for
interviewing in a particular sampled cluster, but nine were ultimately selected in sample 1 for that
cluster. On average, the total sample size target for the survey across all sampled clusters will be
met (barring individual non-response), but in some clusters the exact sample size target may not be
met.
3. It was previously noted that when using systematic PPS sampling at the first stage of sampling, it is
possible to select the same cluster more than once. Although this is rare, when this happens, the
two (or more) selections of the same sampled cluster should be treated separately. In this case, at
50
Note that in the above example, one of the three possible samples produces more than the targeted number of sampled
participants per cluster (i.e., 9 instead of 8). However, there are also examples where some samples produce fewer than the
targeted number of sampled participants. For example, if B = 25, b = 9, then k
rounded
= 3. In this case, there are three possible
samples, but only one of them will have nine participants selected (i.e., the targeted number); the other two will have eight
participants selected (i.e., fewer than the targeted number.)
Participant-Based Survey Sampling Guide for Feed the Future Annual Monitoring Indicators 74
the second stage of sampling, the treatment within sampled clusters depends on which method is
used at the second stage of sampling: fractional interval systematic sampling or systematic
sampling.
When the same cluster is selected twice at the first stage of sampling and fractional interval
systematic sampling is used at the second stage of sampling, the list of participants in the cluster
should be divided in two equal parts, and separate sampling using fractional interval systematic
sampling should take place in each half of the cluster. This is to ensure that there will not be any
overlap in the two samples of participants within the same sampled cluster. In this case, there will
be B / 2 participants in each of the two parts and b / 2 participants should be sampled in each of the
two parts.
When the same cluster is selected twice at the first stage of sampling and systematic sampling is
used at the second stage of sampling, two distinct random starts should be chosen for the sampled
cluster, and, on this basis, two distinct samples of participants will be chosen from within the same
cluster. The use of two distinct random starts ensures that the two samples of participants within
the same sampled cluster will not overlap. Note by way of illustration that in the above example,
samples 1, 2, and 3 are distinct samples with no overlap of participants.

Participant-Based Survey Sampling Guide for Feed the Future Annual Monitoring Indicators 75
10. The Producer Groups Approach (Approach 2)
This chapter provides details on how to implement
the PGs approach. This approach uses the same
survey design steps as the household survey
approach, that is to say: choose a survey design
option (although there is only one option for this
approach), calculate the sample size, choose the
number of clusters (PGs) to select, select a sample
of clusters (PGs), and select the survey
respondents. The specifics of each of these steps
are described in the following sections.
10.1 Choose a Survey Design
Option
For the PGs approach, a new survey design option
is used.
• Survey design option 4: Two-stage cluster
design of PGs, with “take all” selection of
participants within sampled PGs at the second
stage of sampling.
One basic difference between this survey design
option and the first two of the three survey design
options using two-stage sampling discussed under the household survey approach is that PGs rather
than villages/communities constitute clusters, and the surveys take place at the same time as project
implementation with the PGs. Another difference is that “take all” selection of participants, rather than
a sample selection of participants, is used at the second stage of sampling.
At the first stage, a sample of PGs (clusters) is selected from the first stage frame of all PGs using
fractional interval systematic sampling. After PGs are selected from the sampling frame, the sampled
PGs are visited during the next PG meeting. At the second stage, a comprehensive list of all participants
within the selected PGs is used to ensure that all participants have a chance to be interviewed. Any
participants who are absent from the PG meeting should be treated as non-respondents and sample
weight adjustments should be made to compensate for the missing data. See Chapter 11 for more
details.
10.2 Calculate the Sample Size
For the PGs approach, the overall number of participants to sample in the survey, n
final
, is calculated the
same way that it is in the household survey approach described in Section 9.2.
Figure 3f. Steps in the Approach

Participant-Based Survey Sampling Guide for Feed the Future Annual Monitoring Indicators 76
10.3 Choose the Number of Producer Groups to Select
To determine the number of PGs (clusters) to select, the same approach is followed as was used in
Section 9.3. However, because clusters are PGs (rather than villages or communities) and because b, the
number of participants per PG, tends to fall in the 15–30 range for Feed the Future IPs, it is not
necessary to calculate minimum and maximum values for b. The exploratory work undertaken by the
USAID-funded Food and Nutrition Technical Assistance Project (FANTA) prior to drafting this guide
revealed that most projects tend to choose a roughly fixed size for their PGs (e.g., 20), and, therefore,
when using PGs as clusters, b is roughly constant. As a result, the following formula can be used to
determine the number of PGs (m) to select based on n
final
and the roughly constant value for b:
=
(
)
10.4 Select a Sample of Producer Groups
The next step in the survey design process is to randomly select a sample of clusters, which in this case
are PGs, from the sampling frame of all the PGs in which the project is implemented. Note that it is
important for survey implementers who wish to use the PGs approach to maintain a complete and
comprehensive list frame of active PGs from which to sample at the first stage.
To select a sample of PGs, survey implementers should use fractional interval systematic sampling, as
described in Section 9.4.2, rather than systematic PPS sampling. This is because most PGs are of
approximately the same size, and therefore there is little benefit to using systematic PPS sampling.
Recall that for systematic PPS sampling, clusters with a greater number of project participants have a
greater chance of being selected from the frame, while clusters with a fewer number of project
participants have a smaller chance of being selected from the frame. However, survey implementers
should use systematic PPS sampling only if PG sizes vary widely.
10.5 Select All Participants within Sampled Producer Groups
The final step in the survey design process for the PGs approach is to select the survey respondents. It is
key that survey implementers maintain a complete and comprehensive second stage frame of all
participants within all active PGs. Because there is only a small number of participants in a typical PG
(typically 15–35), the recommendation is to interview all participants in a sampled PG. This approach is
called “take all” sampling. If some of the participants within a sampled PG do not participate in a PG
meeting where data are being collected, a sample weight adjustment for participant non-response
should be made to compensate. See Chapter 11 for more details.
Note that, under the PGs approach, it is important to interview selected participants individually rather
than in a group. Group interviews could induce response biases stemming from the propensity toward
social desirability outcomes and potential competition between participants. In addition, because of the
sensitivity of the data collected (i.e., value of sales, volume of production, etc.), group reporting could be
considered an infringement of individual confidentiality protection. However, interviewing 15–35
participants in a PG during one session can be time-consuming for participants, particularly if they are
interviewed individually, given the need for each participant to “wait for his or her turn.” One potential
way of minimizing the waiting time for participants is to establish a dedicated PG meeting for the sole
Participant-Based Survey Sampling Guide for Feed the Future Annual Monitoring Indicators 77
purpose of data collection and to ensure that there are sufficient interviewers so that the ratio of
participants to interviewers is no more than 3 or 4 to 1. Another potential way to mitigate this problem
is to introduce a second stage of sampling within each selected PG so that only a subset of the 15–35
participants in a sampled PG is interviewed. However, this means that additional PGs need to be
sampled at the first stage to maintain the original sample size. This solution is complex to implement in
the field and so should be considered only as a last resort solution.
One of the potential disadvantages to the PGs approach (assuming a “take all” sampling approach) is
that the final sample size may deviate somewhat from the target sample size because the approach is
dependent on the participation of all participants for the selected PG meeting(s) where data are
collected. However, if attendance at PG meetings is known to be low, it is still possible to safeguard
against a shortfall in the sample size. To do so, one can use a larger adjustment for anticipated individual
non-response when computing the sample size. See Section 9.2.3 for more details. Another
disadvantage to this approach is the potential for bias in the results, because participants who attend PG
meetings may be more likely to apply new management practices and technologies or may be more
likely to have higher yields than those farmers who do not attend PG meetings.

Participant-Based Survey Sampling Guide for Feed the Future Annual Monitoring Indicators 78
DATA ANALYSIS: SAMPLE WEIGHTING AND THE
CONSTRUCTION OF INDICATOR ESTIMATES
AND THEIR CONFIDENCE INTERVALS AND
STANDARD ERRORS
CHAPTERS
11. Sample Weighting .............................................................................................. 79
12. Producing Estimates of Indicators of Totals ....................................................... 91
13. Producing Confidence Intervals and Standard Errors Associated with the
Indicators of Totals ............................................................................................. 93

Participant-Based Survey Sampling Guide for Feed the Future Annual Monitoring Indicators 79
11. Sample Weighting
After data collection is completed, there are a number of post-fieldwork activities that typically take
place prior to and in support of data analysis. First, the data are entered or uploaded into a database. If
paper questionnaires were used, then double data entry
51
is typically used to help minimize errors in
data entry. The data are then “cleaned.” This usually means that the data entry software was designed
to allow only valid data ranges (e.g., participant ages must be between 15 and 80 years), to check that
questionnaire logic has been adhered to (e.g., skips and filters respected), and to flag for resolution of
any logic inconsistencies in the data (e.g., a 4-year-old married participant).
52
After data cleaning, a
check is typically performed to make sure that there are no “outlier” values (e.g., a producer with sales
of US$1 million). Sampling weights are then constructed to reflect the various stages of sampling. A
sampling weight is attached to each of the respondents on the cleaned data file. Finally, data analysis,
which includes the production of estimates of the annual monitoring indicators and their associated
confidence intervals and standard errors, takes place.
This chapter and the next two chapters address the three topics of sample weighting, producing
estimates of indicators, and producing confidence intervals and standard errors associated with the
indicators.
The first step to take before data analysis is to calculate the sample weights associated with each of the
participants who have been randomly selected in the PaBS and who have responded to the survey
interview questions. Sample weights for selected participants are calculated and applied to
corresponding individual survey data record(s) to inflate the participant data values up to the level of
the population of participants. In essence, sample weights are a means of compensating for having
collected data on a sampled subset of the participant population, instead of having conducted a full
“census” of all the project participants.
For the survey design options discussed in earlier chapters, sample weights should be calculated and
used in the construction of estimates of each indicator to account and compensate for the following:
• Probabilities of selection at each stage of sampling
• Non-response at the participant level
11.1 Calculating Sample Weights to Reflect Probabilities of Selection
All participants included on a sampling frame have an underlying chance or probability of being included
in the sample. For example, if 1 participant is randomly selected from among 10 possible participants on
51
Double data entry is a data entry quality control method, where, in the first pass through a set of records, an operator enters
data from all records. On the second pass through the batch, a verifier enters the same data. The contents entered by the
verifier are compared with those of the original operator. If there are differences, the data fields or records where there are
differences are flagged for follow-up and reconciliation.
52
In the case where paper-based questionnaires were not used, and some form of computer-assisted personal interviewing
(e.g., using tablets) were used instead, error checks are often programmed into the tablets so that validity and logic errors can
be detected automatically and rectified while still in the field.

Participant-Based Survey Sampling Guide for Feed the Future Annual Monitoring Indicators 80
a sampling frame, the probability of that respondent being selected is 1 in 10 and the associated
sampling weight is 10. One interpretation of a sample weight is that the selected participant represents
all 10 participants—himself or herself, along with 9 other participants who were not selected in the
survey. The individual sample weight of each respondent is multiplied by each value of the respondent’s
data before the quantity is summed across all respondent participants to form an estimate of a total.
When the survey data on participants are used to make inferences about the entire participant
population, the survey-weighted data from the participant used in the example above will have the
effect of “being replicated” 10 times.
11.1.1 Overview of How to Calculate Sample Weights to Account for Probabilities of
Selection
For survey design options 1, 2, and 4, where there are two stages of sampling, the sampling weight
associated with the probabilities of selection for each sampled participant is calculated (in general
terms) using the steps outlined below. The specifics of the general set of steps in relation to each of the
survey design options are mapped out in the sections that follow.
STEP 1. Calculate the probability of selection at the first stage of selection (this corresponds to the
selection of clusters, i.e., villages, communities, or PGs). This is done for each cluster.
=
STEP 2. Calculate the probability of selection at the second stage of selection (this corresponds to the
“conditional” selection of survey participants, assuming that the cluster in which the participant resides
has been selected at the first stage of sampling). This is done for each participant who has been
randomly selected for inclusion in the sample, regardless of whether or not he or she has responded. It
is important to keep track of all survey participants who have been selected for inclusion in the sample
at this stage; an adjustment for the non-responding participants in the sample is made later.
, =
STEP 3. To calculate the overall probability of selection for each participant selected for inclusion in the
sample, f
ij
, multiply the probability of selection at the first stage (for the cluster from which the
participant was selected) by the conditional probability of selection of the participant at the second
stage.
=
STEP 4. To calculate the overall sample weight that reflects the probabilities of selection at each stage,
take the inverse of the quantity calculated in step 3:
=
=
1
=
1
For survey design option 3, there is only one stage of selection and it corresponds to a single stage of
selection of participant j:
=
=
1

Participant-Based Survey Sampling Guide for Feed the Future Annual Monitoring Indicators 81
Note that for survey design option 3,
=
and
=
. This is because there is no stage of sampling
for clusters, and therefore the subscript i is dropped from the notation.
For survey design option 3, although all of the sample weights are identical given that all sampled
participants are selected with the same (equal) probability, it is still necessary to compute and use the
sample weight in the associated analyses. This is because the indicators to be estimated are totals, and
therefore the sample-weighted estimates of the totals must be appropriately inflated to reflect all
participants in the population.
Lastly, for all survey design options (1–4), a non-response adjustment needs to be made to the overall
sampling weight to compensate for the selected participants who did not respond to the survey. More
details on this are provided in the sections that follow.
The previous section provides general formulas for computing sample weights at each stage of sampling.
In the following sections, specific formulas are provided for each of the four survey design options that
are used in this guide. Table 5 provides a summary of the types of sampling recommended for each of
the four survey design options at each stage of sampling. See Sections 9.1 and 10.1 for more details.
Table 5. Summary of Types of Sampling for Each of the Survey Design Options
Survey design
option 1
Survey design
option 2
Survey design
option 3
Survey design
option 4
Sampling of clusters
(at first stage)
Systematic PPS
Systematic PPS or
fractional interval
systematic
Not applicable
Fractional interval
systematic
Sampling of participants
(at first or second stage)
Fractional interval
systematic
Systematic
Fractional interval
systematic
Take all
11.1.2 Calculating the Probability of Selection at the First Stage
For survey design options 1, 2, and 4 (the options where clustering is used), the probability of selection
at the first stage, that is, the probability of selection of a cluster, is calculated differently depending on
which of the selection methods is used—systematic PPS sampling or fractional interval systematic
sampling.
When systematic PPS sampling is used at the first stage of sampling (survey design option 1 or 2), the
probability of selection of the ith cluster is calculated as follows:
=
(
)
=
In the above formula, m is the number of clusters selected (computed in Section 9.3) and B
i
is the total
number of participants in selected cluster i (computed through a count from the sampling frame). The
following illustrates the calculation of the probabilities of selection for systematic PPS sampling,
continuing the example from Section 9.4.1.

Participant-Based Survey Sampling Guide for Feed the Future Annual Monitoring Indicators 82
When fractional interval systematic sampling is used at the first stage of sampling (survey design
options 2 or 4), the probability of selection of the ith cluster is calculated as follows:
=
=
Note that in this case, the probability of selection is the same for all clusters and so does not depend on
which cluster it is (i.e., on i.) The following example illustrates the calculation of the probabilities of
selection for fractional interval systematic sampling, continuing the example from Section 9.4.2.

Participant-Based Survey Sampling Guide for Feed the Future Annual Monitoring Indicators 83
11.1.3 Calculating the Probability of Selection at the Second Stage
The three methods used for selecting participants at the second stage are fractional interval systematic
sampling (for survey design option 1 or 3), systematic sampling (for survey design option 2), and take all
sampling (for survey design option 4). For the first two methods, the formula to use to calculate the
conditional probability of selection for the jth participant in cluster i at the second stage under survey
design option 1 is the following
53
:
=
=
53
Strictly speaking, for the systematic sampling variant, the denominator should include a small adjustment due to the
rounding of the sampling interval, but this can be ignored for simplicity sake because it makes very little difference to the
overall probability.
Participant-Based Survey Sampling Guide for Feed the Future Annual Monitoring Indicators 84
For take all sampling, because the number of participants selected for sampling in any cluster is always
the same as the number of participants in that cluster, f
2ij
always equals 1.
In the above formula, b
i
is the total number of participants to be selected in cluster i, as computed in
Section 9.3. The value for b
i
is not always the same for all selected clusters (particularly with systematic
sampling) and therefore the value of b
i
depends on i. For instance, in the illustrative example in
Section 9.5.3, where survey respondents in the field are selected using systematic sampling under
survey design option 2, the different samples (1, 2, and 3) result in somewhat different values for b
i
. The
value of
, the total number of participants in cluster i, will rarely be the same for all selected clusters,
and therefore the value of
again depends on i.
The calculation of the probabilities of selection at the second stage is illustrated below, continuing the
example from Section 9.5.1, where fractional interval systematic sampling is used at the second stage of
sampling.

Participant-Based Survey Sampling Guide for Feed the Future Annual Monitoring Indicators 85
A
n example of systematic sampling at the second stage of sampling is not provided here, but the
calculation would be similar to that in the example given above.
11.1.4 Calculating the Overall Probability of Selection
Once the probability of selection at the first and second stages of sampling is calculated, the overall
probability of selection for a participant in the sample can be calculated by multiplying the probability of
selection at the first stage by the probability of selection at the second stage.

Participant-Based Survey Sampling Guide for Feed the Future Annual Monitoring Indicators 86
=
When systematic PPS sampling is used in the first stage (survey design option 1 or 2), and either
fractional interval systematic sampling (survey design option 1 only) or systematic sampling (survey
design option 2 only) is used at the second stage (see Table 5), the formula for the overall probability of
selection for a participant j in cluster i is the following:
=
=
=
The following illustrates the calculation of the overall probabilities of selection, continuing the examples
above where systematic PPS sampling is used at the first stage of sampling and fractional interval
systematic sampling is used at the second stage of sampling (survey design option 1). The calculation is
performed for one of the sampled first stage clusters (Glokta) only.
When fractional interval systematic sampling is used in the first stage, and systematic sampling is used
at the second stage (survey design option 2 only; see Table 5), the formula for the overall probability of
selection is the following:
=
=
For survey design option 3, when fractional interval systematic sampling is used to select participants
directly (the only stage of sampling; see Table 5), the formula for the overall probability of selection for
participant j is the following:
=

Participant-Based Survey Sampling Guide for Feed the Future Annual Monitoring Indicators 87
In this case, because there are no clusters, neither B nor b depends on i, and therefore, both are
constants.
For survey design option 4, when fractional interval systematic sampling is used at the first stage of
sampling and a take all strategy is used at the second stage of sampling (see Table 5), the formula for
the overall probability of selection is the following:
=
11.1.5 Calculating the Sampling Weights to Account for Probabilities of Selection
At the final step, the sampling weights to account for the probabilities of selection are calculated by
taking the inverse of the total probability of selection. For survey design options 1, 2, and 4, the formula
is given by:
=
=
1
=
1
For survey design option 3, the formula is given by:
=
=
1
The following illustration demonstrates the computation of the sample weights, continuing the example
above where systematic PPS sampling is used at the first stage of sampling and fractional interval
systematic sampling is used at the second stage of sampling (survey design option 1).

Participant-Based Survey Sampling Guide for Feed the Future Annual Monitoring Indicators 88
11.2 Adjusting Survey Weights for Non-Response
It is to be expected that some percentage of participants randomly selected for the survey will be
unreachable, unavailable, or unwilling to respond to any or all of the survey questions; this is called
“individual non-response.” The recommended survey protocol is that interviewers return to households
up to three times to complete an interview with the selected participants who reside within. Despite the
best efforts of interviewers, however, there will always be some residual non-response that remains
even after three attempts to complete an interview with the respondent. When non-response happens,
adjustments to the sample weights need to be applied to compensate for the non-response.
54
To calculate the weight adjustments for non-response, the survey must track both the selected
participants who do not respond and the selected participants who do respond. Both respondents and
non-respondents have probabilities of selection. But because no interview has taken place for the non-
responding selected participants, the sample weights of the responding selected participants are
inflated to compensate for those who did not respond.
The weight adjustment for non-response for survey design options 1, 2, and 4 is calculated as:
-
=
( )
( )
For survey design options 1, 2, and 4, a weight adjustment for non-response should be calculated
individually for each sampled cluster. The weight adjustments for non-response will vary among clusters
given that clusters will likely experience different non-response rates. However, for all survey
respondents in a particular sampled cluster, the same weight adjustment for non-response can be used.
After the weight adjustment is made, the records for the non-responding sampled participants can be
dropped for the purposes of analysis.
For survey design option 3, a similar adjustment to the one above is made, but at the overall level
instead of at the cluster level.
54
Note that sometimes a sampled participant may provide data for some of the indicators and not for others. In this case, the
participant is deemed a “partial respondent” and the missing data points are called “item non-responses.” Sometimes the
missing data points for the participant are “imputed” using special statistical methods. However, if the number of missing data
points is not large, a common practice is to leave the missing data points blank and to compute the indicators without the
inputs from the missing respondent(s). Because a discussion on methods of imputation is beyond the scope of this guide, it is
assumed that the latter strategy will be adopted for implementers of PaBSs.

Participant-Based Survey Sampling Guide for Feed the Future Annual Monitoring Indicators 89
The following illustrates this, continuing the above example where clustering is involved.
Number of participants in cluster i
B
i
22
Number of participants selected to be interviewed in cluster i
b
i
8
Number of participants who do not respond
(not found, not present or who refuse)
NR
1
Number of participants interviewed
b
i
- NR
7
Weight adjustment to compensate for non-response
w
non-response
1.143
= (8*10.94) / (7*10.94)
11.3 Calculating the Final Sampling Weights
For all four survey design options, the final sample weights to be used in all data analysis are calculated
by multiplying the sample weights (inverse of the probabilities of selection) by the weight adjustment
for non-response:
=
-
The i
llustration below demonstrates this computation, using the example above where systematic PPS
sampling is used at the first stage of sampling and fractional interval systematic sampling is used at the
second stage of sampling (survey design option 1). In this example, of the eight participants selected for
sampling, one does not respond (participant #5, G. Smithy), and the non-respondent record is dropped.
After the non-response adjustment is made, the resulting final sample weight is applied to each
responding participant who was sampled and only the results of responding participants are used in the
analysis of the data.

Participant-Based Survey Sampling Guide for Feed the Future Annual Monitoring Indicators 90
Number of clusters selected
m
4
Total number of participants
N
350
Number of participants in cluster i
B
i
22
Number of participants selected in cluster i
b
i
8
NR
1
Number of participants interviewed in cluster i
b
i
- NR
7
f
1i
= (m*B
i
) / N f
2ij
= b
i
/ B
i
f
ij
= f
1i
* f
2ij
w = 1 / f
ij
w
non-response
w
final
Cl us te r
number
Region Cluster name
Number of
participants
Probability of
selection
(first s tage)
Participant
number
Participant name
Probability of
selection
(second stage)
Probability
of selection
(overall)
Sampling
weight
for
probabilities
of selection
Sampling
weight
for non-
response
Final
sampling
weight
4
Central Region Glokta 22 0.2514 2 G. Grafiti 0.3636 0.0914 10.94 1.143 12.50
5 G. Smithy
0.3636
0.0914 10.94
1.143 12.50
8 Ch. Shaltitch 0.3636 0.0914 10.94 1.143 12.50
11 W. Zebreeks 0.3636 0.0914 10.94 1.143 12.50
13 V. Augustus 0.3636 0.0914 10.94 1.143 12.50
16 R. Hornshnutz 0.3636 0.0914 10.94 1.143 12.50
19 Du. Poonts 0.3636 0.0914 10.94 1.143 12.50
22 M.N. Shevitz 0.3636 0.0914 10.94 1.143 12.50
Number of participants who did not respond in cluster i

Participant-Based Survey Sampling Guide for Feed the Future Annual Monitoring Indicators 91
12. Producing Estimates of Indicators of Totals
After producing final sample weights to be used in data analysis, the next step is to produce estimates
for the agriculture-related annual monitoring indicators that are the focus of this guide, as well as for
any of the other Feed the Future annual monitoring indicators for which data were collected through
the PaBS. As mentioned earlier, three of the four agriculture-related annual monitoring indicators are
totals: “Value of Sales,” “Number of Hectares under Improved Management Practices,” and “Number of
Individuals Using Improved Management Practices.” A description of how to produce estimates of these
indicators of totals is provided in this chapter. The fourth agriculture-related annual monitoring
indicator, “Yield of Agriculture Commodities,” can be expressed as a ratio of totals and each of the
component totals can be estimated separately, or the indicator can be treated as a mean and estimated
as such. In this chapter, the yield indicator is treated as a ratio of totals and a description is provided on
how to produce estimates of the component totals. In Annex 4, a description of how to produce
estimates of indicators of means is provided; this method can be used if survey implementers wish to
produce an overall estimate of the “Yield of Agriculture Commodities” indicator directly.
The aim o
f PaBSs is to facilitate the production of estimates that represent the entire population of
participants, not just the participants in the survey sample. To do so, the sample weights are used to
“inflate” the data from each of the sampled participants who responds, so that a sample-weighted sum
of the data from the surveyed participants provides an estimate of the total (relating to the indicator in
question) for the entire population of participants. The formula for an estimate of a population total is:
= = (
)
where:
w
final
i
= value of w
final
(the final sampling weight) for the ith sampled participant
y
i
= the value of y, the contribution to the indicator (or data point), for the ith sampled
participant
For example, to produce an estimate for the “Number of Hectares under Improved Management
Practices” indicator for the entire survey population of participants, y
i
represents the number of hectares
under improved technologies for survey respondent i. This value is multiplied by the corresponding final
sampling weight (w
final
i
) for respondent i. The same is done for all other survey respondents, and then
these multiplied values are summed across all survey respondents to produce an estimate of the
population total (t).
It can be complicated and time consuming to compute estimates of totals for all annual monitoring
indicators required by Feed the Future, and therefore survey implementers should use a statistical
software package, such as SAS, SPSS, or STATA, to generate the estimates.

Participant-Based Survey Sampling Guide for Feed the Future Annual Monitoring Indicators 92
12.1 Producing Estimates for the Four Indicators
Estimates for the “Value of Sales,” “Number of Hectares under Improved Management Practices,” and
“Number of Individuals Using Improved Management Practices” indicators are produced by a direct
application of the formula given at the beginning of this chapter, using one of the software packages
mentioned earlier.
The fourth indicator, “Yield of Agricultural Commodities,” includes two distinct components or data
points, as defined in Section 2.1. Each of the two components that comprise the “Yield of Agricultural
Commodities” indicator is itself a total, and therefore each component should be estimated using the
formula that integrates the sample weights provided at the beginning of this chapter.
Once sample-weighted estimates of each of the components are produced through one of the software
packages, the estimates should be individually entered into the FFPMIS or the FTFMS. Once all inputs
are entered, the FFPMIS and FTFMS systems will automatically produce estimates for the “Yield of
Agricultural Commodities” indicator.
It is important to note that Feed the Future FFP and non-FFP IPs are required to compute and report in
the FTFMS and FFPMIS systems only on the two data points for the “Yield of Agricultural Commodities”
indicator. They are not required to produce estimates of this indicator directly, but should do so for their
own internal monitoring and target-setting purposes (see Annex 4).
55
12.2 Comparing Indicator Values of Totals over Time
Because Feed the Future IPs tend to increase the number of participants in their projects in the first few
years of project implementation, and then decrease the number of participants as they phase out the
project in the last year, for most Feed the Future projects, the pool of participants for one year is not the
same as the pool of participants for any other year. This introduces a challenge when attempting to
compare any of the annual monitoring indicator values of totals over time.
For instance, if we observe that the “Number of Individuals Using Improved Management Practices”
indicator increased from one year to the next, it is not clear whether the increase was due to an
improved adoption rate among participants or to an expansion of the number of direct participants in
the project between the two years. Although the underlying intention of the indicator is to be able to
track increased adoption rates, it is difficult to tease out this component directly. Therefore, IPs should
carefully interpret the comparison of results over time, taking into account the number of participants in
any given year, to be able to identify the trend of true interest. One way of doing this is to compute the
average value per participant by dividing the estimate of the total by the weighted total number of
participants; the average values (which are considered indicators of means) can easily be computed and
compared over time.
55
Feed the Future IPs are required to set targets for the yield indicator in FTFMS and FFPMIS; however, they are not required to
set targets for the component data points.

Participant-Based Survey Sampling Guide for Feed the Future Annual Monitoring Indicators 93
Statistical software package
For analyses of complex survey data, use…
SAS Specialized survey procedures (e.g., PROC SURVEYMEANS)
SPSS SPSS Complex Samples module
STATA svyset and svy:total syntax
13. Producing Confidence Intervals and Standard
Errors Associated with the Indicators of Totals
An important step in data analysis is calculating confidence intervals and standard errors for all
estimates where the data have been collected through a PaBS. A confidence interval is a measure of the
precision of an estimate and is expressed as a range of numbers that have a specific interpretation. A
standard error is an alternative measure of precision of the estimates of the indicators. It quantifies how
precisely the true value of the indicator is known and takes into account the value of the standard
deviation, as well as the values of the actual sample size and the population size.
56
Although the
reporting of confidence intervals and standard errors is not required by the FFPMIS or FTFMS, Feed the
Future IPs should produce them and include them in their annual monitoring documentation, to provide
a measure of the level of precision of the estimates of indicators produced. This chapter focuses on the
production of confidence intervals and standard errors for indicators of totals. (Annex 4 does the same
for indicators of proportions and means.)
Survey implementers should use a specialized statistical software package that can take into account the
complex design features of PaBSs, such as clustering and unequal probabilities of selection, to generate
the confidence intervals and standard errors. The most widely used statistical software packages are
SAS, SPSS, and STATA. Each of these packages has its own specialized syntax for entering information on
complex survey design features (such as clustering and sample weights) that permits the production of
survey-based estimates of totals, along with their associated confidence intervals and standard errors. It
is critical that the correct syntax for complex survey designs be used, and therefore users should
thoroughly familiarize themselves with such software before undertaking any data analysis. See Table 6
for details on some statistical software packages that can be used.
Table 6. Statistical Software Packages for the Analysis of Complex Survey Data
56
A distinction should be made between the standard deviation of a distribution and the standard error of an estimate. The
standard deviation is defined at the level of the participant and quantifies “scatter” by describing how individual data points
vary from one another across the distribution of participant values. The standard error provides a measure of precision for the
estimate (of an indicator) and is a companion measure to the confidence interval.

Participant-Based Survey Sampling Guide for Feed the Future Annual Monitoring Indicators 94
13.1 Calculating Confidence Intervals and Standard Errors Associated
with Estimates of Totals
The formula to calculate a confidence interval with a confidence level of 95% for the estimate of a total
(denoted by ) is the following:
= () ±
where:
t = the sample-weighted estimate of the total (discussed in Chapter 12)
z = the critical value from the Normal Probability Distribution (discussed in Section 9.2.2)
= the design effect for the survey computed from the survey data
= the standard deviation computed from the survey data
= the actual sample size realized after fieldwork
N = the total number of participants (discussed in Section 9.2.2)
For a confidence level of 95%, the corresponding critical value, z, is equal to 1.96. Survey implementers
should use a confidence level of 95% (and a critical value of 1.96) for calculating confidence intervals,
although values for critical value based on other confidence levels can be found from tables, statistical
software, and spreadsheet software (such as Microsoft Excel).
In t
erms of the design effect for the survey, recall that an estimate of the design effect,
,
is used as an adjustment in the calculation of the target sample size (
), as discussed in
Section 9.2.3. In contrast, the design effect that should be used in the computation of the confidence
interval in the formula above is one that is computed by the statistical software using data from the
fieldwork; it is denoted by
.
In t
erms of the standard deviation of the distribution, recall that an estimate of the standard deviation,
s, used in the calculation of the target sample size (
) is discussed in Chapter 9. In contrast, the
standard deviation that should be used in the computation of the confidence interval in the formula
above is one that is computed by the statistical software using data from the fieldwork; it is denoted by
.
In t
he above formula,
represents the actual sample size realized after fieldwork. This is in
contrast to
, described in Section 9.2.4, which is the target sample size calculated prior to
fieldwork and which takes into account the anticipated non-response. The two sample sizes—
and
—differ in that
will typically be somewhat lower than
given that some non-
response may be encountered in the field.
The formula to calculate the standard error associated with the estimate of a total, t, is the following:
(
)
=
() =

Participant-Based Survey Sampling Guide for Feed the Future Annual Monitoring Indicators 95
Both the confidence interval and the standard error associated with the estimate of the total should be
reported as measures of precision of the estimate. As discussed in the previous chapter, estimates of
the confidence intervals and standard errors should not be computed using formulas found in
spreadsheet software, such as Microsoft Excel. Rather, statistical software (such as SAS, SPSS, and
STATA) should be used to produce confidence intervals and standard errors, so that elements of the
complex survey design are appropriately taken into account. The formulas given above are provided to
give the reader a sense of the computations undertaken by the statistical software packages.
Alternatively, users can use the statistical software to produce values for the inputs to the above
formulas (i.e.,
,
, and t), and then plug these inputs directly into the above formulas to
obtain values for
and ().
13.2 Interpreting Confidence Intervals
The interpretation of a confidence interval is nuanced and is illustrated through the following example.
Suppose the estimate for the “Number of Hectares under Improved Management Practices” indicator is
63,300 hectares and suppose that a 95% confidence interval for the estimate of the indicator is (60,622;
65,978).
The correct way to interpret the above confidence interval is as follows: If a large number of surveys was
repeatedly conducted on the same participant population and if confidence intervals were calculated for
each survey conducted, 95% of the confidence intervals would contain the true value of the indicator
representing the entire population. The confidence interval from the given sample is one such interval.
This does not mean that the probability is 0.95 that the true value of the total number of hectares for
the population is contained in the interval (60,622; 65,978). This is often incorrectly used as the
interpretation for such a confidence interval.
13.3 An Example of Calculating a Confidence Interval and a Standard
Error for an Estimate of a Total
The example below illustrates the computation of a confidence interval and a standard error for an
estimate of the “Number of Hectares under Improved Management Practices” indicator. We assume a
population of participants of size N = 30,000. We also assume that data from a PaBS with an actual
sample size of
= 450 and a design effect of
= 2.5 is used to compute a sample-weighted
estimate of total (t = 63,300) and an associated actual standard deviation (
= 0.611).
57
A 95%
confidence interval around t = 63,300 is then given by (60,622; 65,978) and the standard error of the
estimate is computed as 1,366.
57
Although the figure of s
actual
= 0.611 may seem small relative to the other figures, recall that the standard deviation is defined
at the level of the participant and it describes how the individual values vary from one another.

Participant-Based Survey Sampling Guide for Feed the Future Annual Monitoring Indicators 96
Survey-weighted estimate of
total hectares under improved
management practices
t 63,300 = derived from survey data
Standard deviation
s
actual
0.611 = derived from survey data
Total number of participants N 30,000
Sample size
n
actual
450
Confidence level CL 0.95
Z statistic z 1.96
Design effect 2.5
CONFIDENCE INTERVAL(CI) AND STANDARD ERROR
CI: Lower limit = LL
CI: Upper limit = UL
CI: (Lower limit, Upper limit) = (LL, UL) (60,622, 65,978)
Standard Error of the Estimate
13.4 Calculating Confidence Intervals and Standard Errors for the “Yield
of Agricultural Commodities” Indicator
Because the “Yield of Agricultural Commodities” indicator is a ratio of two components both of which
are totals, the computation of associated confidence intervals and standard errors of the overall
estimate of the indicator is complex. Therefore, if survey implementers desire estimates of confidence
intervals and standard errors for this indicator, they should treat the indicator as a mean and follow the
guidance in Annex 4 on how to do so. Note, however, that it is possible to compute confidence intervals
and standard errors for each of the two component totals separately using the methods described in
this chapter.

Participant-Based Survey Sampling Guide for Feed the Future Annual Monitoring Indicators 97
Annex 1. Scope of Work Template for Participant-Based Survey ........................... 98
Annex 2. Illustrative Job Descriptions for Key Survey Team Members ................ 108
Annex 3. Checklist for Engaging External Contractors .......................................... 110
Annex 4. Participant-Based Surveys for Non-Agricultural Annual Monitoring
Indicators ............................................................................................... 111
Annex 5. Computing Estimates of the “Percentage of Female Participants of
USG Nutrition-Sensitive Agriculture Activities Consuming a Diet of
Minimum Diversity” Indicator ............................................................... 119

Participant-Based Survey Sampling Guide for Feed the Future Annual Monitoring Indicators 98
`
Annex 1. Scope of Work Template for Participant-
Based Survey
Scope of Work for External Contractor
Participant-based survey for annual monitoring
Name of Project, Name of Country
Date of issue
1. BACKGROUND
Background and objectives of project
Provide context that covers the origin and evolution of the project, including the start and end dates and
number of years in operation. Broadly state the project’s goal, objectives, and expected outcomes; the
strategies it is following; and the type of interventions it is undertaking to meet its objectives. Finally,
include information on the donor and funding level of the project.
Geographic scope of project
Indicate the geographic scope of the project and how this has changed in the past or is expected to
change in the future, in addition to the number of participants reached.
Project stakeholders
Provide background information on the respective roles of all project stakeholders.
Previous surveys
Identify any previous participant-based surveys, whether done internally or by other organizations,
which covered the same (or similar) topics for the same (or similar) participant populations in the same
(or similar) geographic area. Indicate whether reports are publicly available, and provide the title and
source (including web address) of the reports.
2. SCOPE OF WORK
State that the survey to be conducted should be participant-based and that the contractor will be
responsible for the following aspects of the survey (although this can be modified to include or exclude
any of these components, should the decision be made to undertake some of these in-house instead):
a. Survey design/sampling plan
• Sample size calculation
• Clustering and selection of units at each stage of sampling
• Specification of methodology for selecting participants at the final stage
b. Questionnaire development
• Development of questionnaire instrument(s)
• Pre-testing, finalizing, and translating questionnaire(s) into local languages
• Printing of questionnaires

Participant-Based Survey Sampling Guide for Feed the Future Annual Monitoring Indicators 99
c. Equipment and logistics
• Provision of all necessary field equipment (tablets, GPS units, etc.)
• Securing of office and computer equipment for survey management and data entry
• Arranging for transportation, lodging, and equipment for fieldwork
d. Data collection
• Recruitment of fieldwork staff (interviewers, supervisors, data entry staff)
• Development of training guide for interviewers
• Training of interviewers and supervisors, conducting pre-test of questionnaire and pilot of
field operations
• Design and oversight of listing operations (if applicable)
• Conducting and overseeing of data collection
e. Data entry and data cleaning
• Development of data entry software and data entry protocols (latter only required for
paper-based data collection)
• Development of quality control measures for data entry and data cleaning
• Data cleaning to ensure logic and consistency checks
f. Data analysis, production of estimates, and report writing
• Calculation and use of sampling weights
• Production of estimates and disaggregates of indicators that ensure complex sample design
taken into account
• Production of confidence intervals and standard errors of indicator estimates
• Submission of report with findings
• Submission of documented data sets where the identity of individual participant
respondents has been anonymized or otherwise had their confidentiality protected
Also list the topics from above for which the contractor will not be responsible.
3. SURVEY OVERVIEW
Survey objective(s)
Describe the main objective(s) of the survey.
Survey type
It should be made clear to the contractor that this is a descriptive survey of participants in support of
annual monitoring.
Geographic scope of survey
Provide the location names, administrative units, and other pertinent details on the geographic area
that the participant-based survey will cover. Indicate if the scope of the survey differs from the scope of
the project.
Survey population of participants
Provide a written description of the participant population (e.g., direct participants living in a particular
district). Provide a total overall number for the survey population in villages, producer groups, and/or
other units. Also provide the source(s) from which these totals were taken.

Participant-Based Survey Sampling Guide for Feed the Future Annual Monitoring Indicators 100
List of Feed the Future annual monitoring indicators to be reported on through the participant-based
survey
A list of Feed the Future annual monitoring indicators (as well as any custom indicators) for which
underlying data are to be collected through the participant-based survey should be provided to the
contractor. These should include, at a minimum, the four challenging indicators that are the focus of this
guide. The PIRSs associated with these indicators should be provided to the contractor as well. (The
complete set of Feed the Future IM indicators and their PIRSs can be found in the publication Feed the
Future Indicator Handbook, which is located at https://www.agrilinks.org/post/feed-future-indicator-
handbook.)
Main audience of survey
The main intended audience for the survey report should be indicated.
Expected dates and duration of consultancy
The expected time frame and duration of the contract should be specified. Refer to the section on
“Work Plan” in Section 7 of this scope of work.
4. SURVEY DESIGN/SAMPLING PLAN
Indicators to be used as basis for sample size calculations
Indicate the key indicators (preferably no more than five and including the three suggested earlier in this
guide) that will serve as a basis for the sample size calculation. Also state if any data exist on the current
value of each of the key indicators within the target populations (from a survey conducted by another
organization, for example). Specify the levels of disaggregation required for which indicator estimates
must be produced.
58
Sample size calculation
If the sample size calculation is to be produced by the contractor, this should be stated. In this case, the
project should provide to the contractor all relevant inputs for such computations (e.g., number of
population participants and targets for indicators, as well as any relevant information from prior surveys
[if it exists], such as values of indicators and standard deviations, the design effects, and the non-
response rates/response rates). The project can opt to specify the desired level of confidence (e.g.,
95%), as well as the acceptable percentage error (p) for the MOE, or the project can leave the
specification of these parameters to the contractor.
Sampling frame(s) and coverage for participant-based survey
Describe the lists from which participants will ultimately be selected.
Frame of Clusters: If cluster sampling is to be used, describe the lists of geographic units that will be
used (e.g., villages/communities or producer groups). In the case that survey design option 1 or 2 is to
be used, it should be stated that a complete list of implementation clusters (villages or communities) will
be provided to the contractor. If survey design option 4 is to be used, it should be stated that a complete
list of producer groups will be provided to the contractor.
58
It should be made clear to the contractor that separate sample size calculations for the various required disaggregates for
Feed the Future annual monitoring indicators need not be undertaken. The one exception to this is the “Yield of Agricultural
Commodities” indicator by commodity type – as noted in Section 9.2.2.

Participant-Based Survey Sampling Guide for Feed the Future Annual Monitoring Indicators 101
Frame of Participants: In the case that survey design option 1, 3, or 4 is to be used, then a complete,
comprehensive, and up-to-date list of participants should be provided to the contractor for the second
stage of sampling. If survey design option 2 is to be used, it should be stated that a complete list of
participants does not exist and that a listing operation will be required to create such a list as part of
survey taking.
Finally, specify whether the lists provided cover the entire participant population. If not, specify the
areas/participants that are not covered by the lists.
Sample selection
If the contractor will be responsible for developing the sample design, state that the contractor should
select units at each stage of sampling in accordance with the possible options below:
Household survey approach
• Survey design option 1 – two-stage cluster design with systematic selection of participants
• Survey design option 2 – two-stage cluster design with listing operation and systematic
selection of participants
• Survey design option 3 – one-stage design with systematic selection of participants
Producer groups approach
• Survey design option 4 – two-stage cluster design with “take all” selection of participants
Sampling weights and the treatment of non-response
It should be specified that the contractor is expected to produce sampling weights for each participant
record on the sampling file to be used in the analysis of data. In addition, the contractor should make
adjustments to the final weights to compensate for any residual non-response encountered at the
participant level.
Production of indicator estimates
The final report should include tables with the following information for each indicator:
Indicator
Name or
Data
Point
a
Level of
Reporting
(overall or
disaggregate)
b
Value of
Indicator
Standard
Error of
Indicator
Confidence
Interval
Design
Effect
Number of Cases
Estimated
Number of
Participants
c
Lower
Limit
Upper
Limit
Number of
Respondents
in Survey
Number of Non-
Respondents in
Survey
a
Both the overall indicator and associated component data points (when relevant) should be reported.
b
Indicators should be reported at the overall level and at every required level of disaggregation.
c
The estimated number of participants can be computed using the sample-weighted number of respondents in the survey.
5. SURVEY QUESTIONNAIRE(S)
Questionnaire development
State whether a questionnaire has already been drafted, or whether the contractor will need to develop
a new questionnaire for the survey. If a questionnaire from a prior survey is to be used as a basis for
development for the questionnaire, it should be provided along with details regarding estimated time
per completed questionnaire module or interview. If the contractor needs to develop a new
questionnaire from scratch, a list of indicators for which questions must be developed should be
provided, along with their associated PIRSs.

Participant-Based Survey Sampling Guide for Feed the Future Annual Monitoring Indicators 102
Translation of questionnaire
State whether the questionnaire needs to be translated or whether a translation will be undertaken by
the project. Explain who will be responsible for engaging the translation service and funding translation
costs, and whether forward- and backward-translation is required. Make sure that translation time is
taken into account in the work plan.
Pre-testing and finalization of questionnaire
State if field pre-testing is required to test the flow, filters, and skip patterns in the questionnaire. Give
any known details on pre-testing: expected duration, pre-testing sites, choice of pre-test respondents,
and number of pre-tests required, as well as the timeline for questionnaire finalization.
6. FIELDWORK OPERATIONS
Human resources for fieldwork
State the human resource requirements for fieldwork by position, including both those that will be
provided by the organization and those that will be provided by the contractor. State the expected level
of education and/or experience, as well as their employment status (volunteer, employee, etc.).
Listing operation(s)
Provide necessary details on expectations relating to listing operation(s) (survey design option 2 only),
such as how much information on each participant should be collected and whether GPS information on
the participant dwellings and/or clusters is required as well. Specify whether GPS equipment will be
provided by the project or by the contractor. Indicate if the contractor will need to produce any maps
during the listing exercise.
Training of interviewers
Provide details on the expectations relating to the training of interviewers, including expected duration
and expected types of activities (e.g., piloting field operations, pre-testing of questionnaire).
Mode of data collection
The preferred mode of data collection should be specified in the scope of work.
• Personal interviews with paper questionnaires
• Personal interviews with PDAs (personal digital assistants) or other computer-assisted collection
• Other (please specify)
Data entry
If data collection is paper-based (rather than tablet-based), state whether the contractor will be
responsible for providing a system to input and manage data entry, and whether there are any specific
hardware or software requirements. State if double data entry is expected. State any expected quality
control mechanisms that the contractor will need to put in place to ensure consistency and logical
coherence of the data during data cleaning.

Participant-Based Survey Sampling Guide for Feed the Future Annual Monitoring Indicators 103
7. WORK PLAN, DELIVERABLES, AND DISSEMINATION
Work plan
The contractor should submit a plan of activities, the following table of which is an example. A Gantt
chart can also be used in place of a table.
Activities
Number
of Days
Expected Dates
Person(s)
Responsible
1. Desk review and discussions with project staff 2
2. Develop and submit an inception report for
approval, which should include the following:
• work plan
• survey design/sampling plan, including
sample size calculations
• data treatment (including quality control
measures) and analysis plan
10
3. Develop survey instrument(s) and translate into
relevant local languages
10
4. Develop data entry system designed for survey,
as well as data entry protocols and specifications
(in case of paper-based data collection)
10
5. Recruit interviewers and supervisors 30
6. Develop training agenda and materials (and
translate)
10
7. Train interviewers and supervisors 5
8. Pre-test and finalize survey instrument(s) 5
9. Oversee listing operation(s) 5
10. Pilot field operations and collect data 20
11. Enter, clean, and analyze data 10
12. Prepare table of indicator estimates and write
short report
10
13. Prepare data set for submission 5

Participant-Based Survey Sampling Guide for Feed the Future Annual Monitoring Indicators 104
Deliverables
The contractor should be given a set of expected deliverables and their deadlines. Indicate the language
required for all deliverables and what role, if any, the contractor is expected to play in translations or
reviews of translated text. Also state any page limitations. The following is an example of a set of
deliverables:
Deliverables
Expected Deadline
1. Inception report (which includes the work plan, survey design/sampling plan,
and data treatment and analysis plan)
2. Finalized survey instrument(s), in English and in relevant local language(s)
3. Training manual(s) for field staff, in English and in relevant local language(s)
4. All data files in SAS, SPSS, or STATA format (sampling frame[s], raw data sets,
transformed data sets and syntax, edit rules, code book/data dictionary,
sampling weights). The data sets must have all personally identifiable
information removed. A version of the data sets must be provided in CSV
format in accordance with the USAID Open Data Policy; data sets should not be
provided in a format generated by proprietary software.
5. Tables of indicator estimates along with their confidence intervals and
standard errors; short report
8. LOGISTICS AND REPORTING
Logistics and administrative support
The scope of work should indicate any requirements that have a bearing on costs (such as travel) and
state who will finance them. It should be clear on the extent to which any human resources (e.g.,
translator, driver) or logistical support (e.g., computers, office space, vehicles) will be provided free of
charge to the contractor.
Reporting relationships
The name and title of the designated survey manager within the Feed the Future project to whom the
contractor will report should be stated.
Language on future use of data
Within the scope of work, language should be included to the following effect: “The completed data set
will be the sole property of USAID. The contractor may not use the data for its own research purposes,
nor license the data to be used by others, without the written consent of USAID.” Precise wording can
be crafted in consultation with USAID.
9. OBLIGATIONS OF KEY PARTICIPANTS IN SURVEY
It is useful to detail the obligations of each party in the survey to set realistic expectations and
accountabilities. The following is an example.
Contractor
a. Inform the Feed the Future survey manager in a timely fashion of progress made and of
problems encountered.

Participant-Based Survey Sampling Guide for Feed the Future Annual Monitoring Indicators 105
b. Implement the activities as expected, and, if modifications are necessary, bring them to the
attention of the Feed the Future survey manager before enacting any changes.
Feed the Future project survey manager
a. Ensure that the contractor is provided with the specified documents and adequate human
resources and logistical support.
b. Facilitate the work of the contractor with participants and other local stakeholders.
c. Answer day-to-day enquiries, monitor the daily work of the contractor, and flag concerns.
Feed the Future project technical staff
a. Review and approve the proposed methodology.
b. Provide technical oversight in the review of all deliverables.
c. Provide timely comments on any draft reports.
10. REQUIRED QUALIFICATIONS OF CONTRACTOR
The scope of work should state the required qualifications expected for all key positions and how this
information should be presented in the bid or proposal. Any language or diversity requirements that
factor into the selection decision should be indicated. Illustrative examples of job descriptions for key
survey team members can be found in Annex 2.
11. SUBMISSION OF PROPOSALS
Proposal submission details
The scope of work should be clear on which documents to submit, how proposals should be submitted
(by email, uploading to website, regular post, etc.), and to whom to address proposal submissions. The
exact date and time deadline (with time zone) for receiving bids should be given. It should be clearly
specified that any bids received after the deadline will not be considered.
Proposal outline
A suggestive format for the proposal is outlined below:
a. Background: Brief background about the objectives of the study should be included in the
proposal.
b. Work plan: The proposal should clearly mention details of each and every activity, including
those mentioned in the work plan in Section 7.1 of this scope of work. The timeline and
person(s) responsible for each activity should be clearly stated.
c. Survey design/sampling plan: The proposal should provide information on the overall survey
design, covering an overview of the treatment of all of the items in Section 4 of this scope of
work.
d. Training: The proposal should state who will be responsible for training interviewers and
supervisors, and should describe the topics covered, expected duration, and logistic and
administrative support needed.
e. Field team: There should be a clear indication in the proposal of the number of individuals
needed for data collection and listing operations, by position.

Participant-Based Survey Sampling Guide for Feed the Future Annual Monitoring Indicators 106
f. Quality control mechanisms during data collection: The proposal should provide a section that
details the mechanisms that will be put in place to ensure data quality, clearly specifying steps
for data validation. This section may also include supervisory mechanisms for data quality and
the role of field editors.
g. Data entry and processing plan: This section of the proposal should clearly state details on data
entry (if paper-based data collection is used), validation (logical and consistency) checks, and
other data-processing activities.
h. Data analysis and report writing: The proposal should provide details on the analyses that will
be carried out and the person/people responsible for data analysis and the writing of the
summary report.
i. Contractor division of labor: There should be a section of the proposal that provides
information on key professionals and their level of effort for the different activities of the
survey. An illustrative matrix is provided below:
Name
Level of Effort (number of days)
Sampling
Plan
Instrument
Development
Training
Data
Collection
Data Entry
and
Cleaning
Data
Analysis
Short Report
(including tables of
indicator estimates)
j. C
ontractor Expertise: This section of the proposal should highlight past experience of the
contractor in conducting similar surveys, preferably with complex sample designs and in
developing countries. The section should mention names, qualifications, and experiences of all
persons who would be involved in various aspects of conducting the survey.
k. Progress updates: This section of the proposal should clearly indicate the mechanism that will
be used to communicate with the Feed the Future survey manager in providing regular updates
on field activities, coverage rate, data entry status, etc.
Detailed Budget: There are three approaches that can be taken concerning the budgeting of the
evaluation:
• No budget is specified and bidders are requested to provide both technical and financial
proposals. In this case, bidders can specify a preferred methodology, estimate its costs, and
have control over their ability to meet the deliverables.
• The project specifies a maximum budget in the scope of work and the bidders are requested
only to provide technical proposals. Bidders are expected to match their proposed methodology
and work plan to the budget.
• The project specifies a maximum budget in the scope of work and invites both technical and
financial proposals to see if the contractor has a good understanding of how much it will cost to
carry out the needed tasks and if funds can be economized. However, bids will not usually come
in for much less than the maximum budget specified, and selection will usually be on the basis
of the quality of the technical proposal.
Under the first option, a wider range of proposed methodologies may be received, although some may
exceed the maximum amount budgeted for the survey. Under the second and third options, the Feed

Participant-Based Survey Sampling Guide for Feed the Future Annual Monitoring Indicators 107
the Future IP can more directly control the budget, but in some cases this approach may lead to a lower
number of proposals and/or proposed methodologies that are suboptimal in terms of rigor or scope.
If a budget is required as part of the proposal, it should provide the estimated budget for each activity,
clearly mentioning rates and how rates are estimated. Possible line items are suggested below:
a. Daily rate of key professionals
b. Travel costs
c. Training costs
i. Listers/mappers, supervisors, interviewers, data editors
ii. Instrument pre-testing and field operations piloting costs
iii. Other costs
d. Field expenses
i. Payment of field staff (e.g., listers/mappers, supervisors, interviewers, data editors)
ii. Travel cost of field staff during data collection (e.g., accommodations, per diems)
iii. Other costs (e.g., printing of questionnaires, vehicles, GPS equipment, PDAs/tablets)
e. Data entry (including laptops and computer software)
f. Data cleaning, analysis, and report writing
g. Preparation of data sets for sharing
h. Other costs
12. SELECTION PROCESS
The selection process and the criteria (along with relative weightings of each of the criteria) that will be
used should be described.
Questions from bidders
Before the deadline for receiving bids has passed, a clear protocol should be developed on how to
accept and respond to questions from potential bidders. Answering questions from potential bidders
will likely increase the quality of received proposals. Typically, a clear deadline is specified by which any
questions must be submitted (and to whom they should be addressed), and an indication is also given
regarding when responses will be provided. A specified process should be put in place through which
questions are collected during a certain time period, typically using an online mechanism where bidders
do not need to reveal their identities to other bidders. Answers should then either be posted online or
sent by email to all bidders.

Participant-Based Survey Sampling Guide for Feed the Future Annual Monitoring Indicators 108
Annex 2. Illustrative Job Descriptions for Key
Survey Team Members
SURVEY TEAM LEADER
1. Postgraduate degree from a recognized university in development studies, project
management, project monitoring and evaluation, or other relevant field of study
2. Minimum of 5 years of experience in a senior management position for an international
development organization
3. Prior experience leading at least two large-scale, complex participant-based or household
surveys (preferably in resource-constrained environments)
4. Demonstrated expertise in managing budgets, staff, logistics, contracting, and other support
staff issues
5. Strong experience in partnering and interacting with international multinational donors and in-
country governmental authorities
6. Excellent interpersonal, presentation, and communication skills, and a demonstrated ability to
deliver a high-quality product
7. Prior professional experience in country or region preferred
8. Fluency in English (or French for Francophone countries or Spanish for Spanish-speaking
countries, etc.) required; fluency in relevant local language(s) an advantage
SENIOR SURVEY SPECIALIST
1. Postgraduate degree from a recognized institution relating to survey methodology, statistics,
monitoring and evaluation, or social sciences research
2. Experience designing and leading the implementation of large-scale, clustered, multistage
participant-based or household surveys (preferably in resource-constrained environments)
3. Experience developing survey inception reports and work plans, and in managing the
administrative, logistical, and budgetary functions of large-scale surveys
4. Experience developing, overseeing translations of, pre-testing, and finalizing survey instruments
5. Experience in developing survey training materials and data collection manuals (for supervisors
and interviewers)
6. Experience in overseeing data entry (for paper-based data collections) and editing processes
7. Expertise analyzing complex survey data (including calculating sampling weights); strong
knowledge of at least one statistical software package (SAS, SPSS, STATA, etc.)
Participant-Based Survey Sampling Guide for Feed the Future Annual Monitoring Indicators 109
8. Experience presenting survey results to high-level project stakeholders
9. Prior experience with surveys with similar purpose, mode, and populations strongly preferred
10. Prior professional experience in country or region preferred
11. Fluency in English (or French for Francophone countries, or Spanish for Spanish-speaking
countries, etc.) required; fluency in relevant local language(s) an advantage
FIELD OPERATIONS MANAGER
1. Undergraduate degree from a recognized institution
2. Experience supervising fieldwork for large-scale participant-based or household surveys
(preferably in resource-constrained environments)
3. Experience recruiting, training, and managing field supervisors and interviewers
4. Experience coordinating field logistics, schedules, and equipment
5. Experience managing data quality control in the field during survey implementation
6. Strong interpersonal skills, ability to solve problems when confronted with roadblocks during
survey fieldwork
7. Prior professional experience in country or region preferred
8. Fluency in English (or French for Francophone countries, or Spanish for Spanish-speaking
countries, etc.) required; fluency in relevant local language(s) also required

Participant-Based Survey Sampling Guide for Feed the Future Annual Monitoring Indicators 110
Annex 3. Checklist for Engaging External
Contractors
# Evaluation factor Critical Important
1
Survey team leader has designed and led a minimum of two large-
scale, complex participant-based or household surveys (i.e., clustered,
multistage surveys) in resource-constrained environments in the past
5 years
2
Senior survey specialist has demonstrated expertise in calculating
sample sizes, designing surveys, and analyzing complex survey data
3
Survey team includes, at a minimum, a survey team leader, a senior
survey specialist, and a field operations manager
4
At least one member of the survey team (or local subcontracting
team) speaks each local language in which the survey will be
administered
5
Contractor proposal includes high-quality sampling plan that adheres
to all requirements specified in the scope of work
6
Contractor proposal includes details on quality control processes to be
used before, during, and after data collection
7
Contractor can provide contact information for professional
references for whom contractor has implemented surveys in the past
8 Contractor has previous survey-related experience in the country

Participant-Based Survey Sampling Guide for Feed the Future Annual Monitoring Indicators 111
Annex 4. Participant-Based Surveys for Non-
Agricultural Annual Monitoring Indicators
Thus far in this guide, the discussion has focused on PaBSs that collect Feed the Future agricultural
annual monitoring indicators. However, some Feed the Future projects have interventions in other
sectors as well, such as MCHN and WASH. Feed the Future IPs must collect data and report on all
relevant Feed the Future annual monitoring indicators related to the sector in which there are
associated interventions and to which they are contributing results. Some of these annual monitoring
indicators can be collected through routine monitoring, but in some cases, it is also appropriate to use
PaBSs.
This annex discusses adaptations to the approaches discussed in the main body of this guide when
implementing PaBSs in relation to MCHN and WASH indicators. Many of the key adaptations stem from
the fact that the indicators to be collected through such PaBSs relate to different types of indicators
beyond totals, including proportions and means. Special consideration is also needed in terms of the
various distinct sampling frames associated with the MCHN and WASH indicators. The annex focuses on
the adaptations that must be made when using indicators of proportions and means in such PaBSs, as
well as the considerations that must be made to accommodate distinct sampling frames.
A4.1 The Two Approaches: Household Survey Approach and Producer
Groups Approach
The two PaBS implementation approaches described in this guide are the household survey approach
(Chapter 9) and the PGs approach (Chapter 10). Both approaches can be used for PaBSs in support of
MCHN and WASH interventions, but with a few essential adjustments. For instance, although the PGs
approach is applied in agriculture-related interventions where, say, FFSs are used as part of the
intervention package, the approach can be adapted to analogous contexts in MCHN- and WASH-related
contexts where, for example, Mother Care Groups are used as part of the intervention package.
A4.1.1 Calculating the Sample Size
One of the adjustments that must be made to both approaches is the calculation of the sample size
when considering key indicators that are not totals (e.g., proportions or means). Details on how to
compute the sample size in such cases is provided below.
Indicators to Use as a Basis for Sample Size Calculation
Most Feed the Future indicators can be expressed as totals, proportions, or means. The Feed the Future
annual monitoring indicators relating to MCHN and WASH are either totals or proportions (i.e.,
expressed as percentages) and are listed in Table A4.1.
In addition, Feed the Future IPs often develop their own custom annual monitoring indicators that do
not have to be reported back to Feed the Future, but that are used as part of the overall monitoring

Participant-Based Survey Sampling Guide for Feed the Future Annual Monitoring Indicators 112
process by IPs.
59
These custom indicators vary from IP to IP and can also take the form of totals,
proportions, or means. An example of a custom MCHN indicator that is a mean is also included in
Table A4.1; there are no Feed the Future MCHN or WASH annual monitoring indicators that are means
and therefore this indicator is included in the table for illustrative purposes only.
59
However, Feed the Future encourages IPs to upload their custom indicator reporting as part of the documentation in FTFMS.
Feed the Future will be working on adjusting FTFMS to allow direct entry of custom indicators in the future.

Participant-Based Survey Sampling Guide for Feed the Future Annual Monitoring Indicators 113
Table A4.1 Feed the Future and Custom MCHN and WASH Annual Monitoring Indicators
Indicator
Type of
Indicator
Sampling Group Implicated
Source of
Indicator
Intervention
Sector
1. Number of People Gaining Access to a Basic Sanitation Service as a Result of
USG Assistance
Total Households participating in WASH interventions
a
Feed the
Future
WASH
2. Percentage of Households with Soap and Water at a Hand Washing Station
Commonly Used by Family Members
Proportion Households participating in WASH interventions
Feed the
Future
WASH
3. Number of Children under Two (0–23 months) Reached with Community-
Level Nutrition Interventions through USG-Supported Programs
Total
Children under two participating in community-
level MCHN interventions
Feed the
Future
MCHN
4. Number of Children under Five (0–59 months) Reached with Nutrition-Specific
Interventions through USG-Supported Programs
b
Total
Children under five participating in community-
level MCHN interventions
Feed the
Future
MCHN
5. Number of Pregnant Women Reached with Nutrition-Specific Interventions
through USG-Supported Programs
Total
Pregnant women participating in community-level
MCHN interventions
Feed the
Future
MCHN
6. Percentage of Female Participants of USG Nutrition-Sensitive Agriculture
Activities Consuming a Diet of Minimum Diversity
c
Proportion
Female participants of community-level MCHN
interventions that have nutrition-sensitive
agriculture activities
Feed the
Future
MCHN
7. Women’s Dietary Diversity Score (WDDS) for Caregivers of Children under
Two Participating in Community-Level MCHN Interventions
Mean
Caregivers of children under two participating in
community-level MCHN interventions
Custom
(example
only)
MCHN
8. Percentage of Participants of Community-Level Nutrition Interventions Who
Practice Promoted Infant and Young Child Feeding Behaviors
Proportion
Caregivers of children under two (reported under
indicator 3) participating in community-level
MCHN interventions
Feed the
Future
MCHN
9. Number of Individuals Receiving Nutrition-Related Professional Training
through USG-Supported Programs
Total
N/A
d
Feed the
Future
MCHN
a
Households are considered in the sampling group for this indicator, even though the indicator is expressed in terms of people. The number of people living in households are estimated using results from the
survey and used as a basis to calculate the indicator.
b
Indicator 4 may be applicable to three types of Feed the Future projects: a) those that support national public health campaigns (such as “child health days”), b) health-systems strengthening projects (that help
improve facility-based nutrition-specific service delivery), and c) those implementing community-level MCHN interventions. For projects of type a) and b), data relating to indicator 3 are typically collected
through routine monitoring (e.g., from ministries of health). Indicator 5 may also be applicable to project type b), with data collected through routine monitoring. This guide focuses on projects of type c) only –
where data can be collected through PaBSs. Therefore, the sampling group in this table has been limited to children under five or pregnant women participating in community-level MCHN interventions.
c
Nutrition-sensitive agriculture activities can be embedded in either agriculture interventions or community-level MCHN interventions (such as the promotion of home gardens); this annex focuses on the latter.
In the cases where nutrition-sensitive agriculture activities are embedded in both, there may be participants who engage in both sets of interventions, creating an overlap in the set of participants across the two
types of project interventions. Relatedly, data on this indicator can be collected through both agriculture-related or MCHN-related PaBSs. However, when participants in the agriculture and the MCHN nutrition-
sensitive agriculture interventions overlap, and data related to this indicator are collected through both types of PaBSs, special methods are required to produce one overall estimate for the indicator by
combining data from both PaBSs while taking into account the double-contribution to the estimate from the overlap portion. More details on this method are provided in Annex 5.
d
The data for this indicator is collected through routine monitoring rather than through PaBSs, and therefore the concept of sampling group is not relevant here. Data on this indicator are collected on health
professionals, primary health care workers, community health workers, volunteers, policy makers, researchers, students, and non-health personnel (e.g., agriculture extension workers), but not community-level
participants, such as mothers receiving counseling on maternal, infant, and young child feeding.
Participant-Based Survey Sampling Guide for Feed the Future Annual Monitoring Indicators 114
Special attention should be given to the sampling groups associated with the indicators to be collected
through a PaBS. Recall that for the set of four agriculture indicators under consideration in the main
body of this guide (“Yield of Agricultural Commodities,” “Value of Sales,” “Number of Hectares under
Improved Management Practices,” and “Number of Individuals Using Improved Management
Practices”), the target population definitions were intentionally limited so that the sampling frames
were identical for all four indicators, and consisted of producers (both smallholder and non-smallholder)
in crop, livestock, and aquaculture production systems (see Table 1b in the main body of the guide). This
was important because it implied the use of one sampling frame that facilitated the implementation of
one PaBS (rather than multiple PaBSs) across all four indicators.
In contrast, the sampling groups implicated by the first eight indicators in Table A4.1 span a variety of
sampling groups within various interventions. For instance, for the WASH indicators, we have
households participating in WASH interventions (indicators 1 and 2). For the MCHN indicators, we have
children under two participating in community-level MCHN interventions (indicator 3), children under
five participating in community-level MCHN interventions (indicator 4), pregnant women participating in
community-level MCHN interventions (indicator 5), female participants of community-level MCHN
interventions that have nutrition-sensitive agriculture activities (indicator 6), and caregivers of the
children under two participating in community-level MCHN interventions (indicators 7 and 8).
It is not possible to nest the definitions of the sampling groups in Table A4.1 so that the data collection
can be undertaken within one PaBS. For the first eight indicators in Table A4.1, there would need to be
several PaBSs conducted associated with the various distinct sampling groups, although some nesting of
sampling groups may be possible. For instance, it is possible to collect data on indicators 3 and 4 within
the same PaBS, since the sampling group for indicator 3 is a subset of that for indicator 4. The data on
indicators 1 and 2 can be collected within the same PaBS, as can the data for indicators 7 and 8, because
the sampling groups are the same for the indicators in each of the pairs. Although it is possible that the
participants from the various sampling groups in Table A4.1 intersect or are subsets of each other in
some way, the degree of intersection will be project-specific and can be determined only through an
analysis of the participant lists of the various interventions of IP projects.
Therefore, as an overall strategy, survey implementers should list the MCHN and WASH annual
monitoring indicators (both Feed the Future and custom) for which data must be collected. Then,
indicators should be grouped together according to their common sampling groups. Indicators whose
sampling groups are subsets of other sampling groups can be grouped together with the indicators
whose sampling groups subsume them. The strategy implies that the list of sampling groups associated
with the IP’s custom indicators should be analyzed to see if any of them coincide with or are a subset of
one of the sampling groups associated with the Feed the Future annual monitoring indicators in
Table A4.1; if so, these indicators should be grouped together. The intention is then to conduct separate
PaBSs to collect data in support of the indicators associated with each of the distinct sampling groups
(including their subsets). However, when only one or two indicators fall into a specific sampling group, it
may not be worth the required resources to conduct a separate PaBS, and the collection of data in
support of such indicators through routine monitoring may be the preferred approach.
Regardless of how many PaBSs must be conducted, for any specific PaBS, one indicator only, from
among all indicators on which data are to be collected, can determine the overall sample size for the
specific survey. As previously discussed, the general recommendation is that the sample size for all key

Participant-Based Survey Sampling Guide for Feed the Future Annual Monitoring Indicators 115
indicators from among the indicators being collected in a given survey be calculated and that the largest
sample size resulting from all candidate sample sizes computed be chosen.
However, for a WASH-related PaBS based on a sampling frame that encompasses “households
participating in WASH interventions,” Feed the Future recommends including “Percentage of
Households with Soap and Water at a Hand Washing Station Commonly Used by Family Members”
(indicator 2) as a key indicator on which to base the sample size computation; other Feed the Future or
custom indicators deemed key by the IPs can be included, as well.
Similarly, for an MCHN-related PaBS based on a sampling frame that encompasses “caregivers of the
children under two participating in community-level MCHN interventions,” Feed the Future
recommends including “Percentage of Participants of Community-Level Nutrition Interventions Who
Practice Promoted Infant and Young Child Feeding Behaviors” (indicator 8) as a key indicator on which
to base the sample size computation; other Feed the Future or custom indicators deemed key by the IPs
can be included as well.
Table A4.1 includes indicators of all three types: totals, proportions, and means. Section 9.2.2 provides
guidance on how to compute sample sizes for indicators of totals. The next two sections provide
guidance on how to compute sample sizes for indicators of proportions and means.
Formula to Calculate the Sample Size Based on a Proportion
The formula for calculating the initial sample size for the estimation of indicators of proportions is given
by:
=
=
(1 )
where:
z = critical value from Normal Probability Distribution.
P = an estimate of the true (but unknown) population proportion. For the first year that a PaBS
is conducted, a value can be obtained from a recent external survey that collects data on the
same indicator, conducted in the same country or region of the country. For subsequent years
that a PaBS is conducted, the value obtained from survey results in the prior year can be used.
MOE = margin of error = p. The term p denotes an acceptable percentage error, and is typically
subjectively specified to range between 5% and 10% (expressed as p = 0.05 and p = 0.10,
respectively). For purposes of Feed the Future annual performance monitoring, p = 0.10 should
be used.
The same three adjustments as those described in Sections 9.2.3 for indicators of totals should be
applied here to the initial sample size to arrive at a final sample size.
Formula to Calculate the Sample Size Based on a Mean
The formula for calculating the initial sample size for the estimation of indicators of means is given by:
=
=

Participant-Based Survey Sampling Guide for Feed the Future Annual Monitoring Indicators 116
where:
z = critical value from Normal Probability Distribution.
s = standard deviation of the distribution of participant data. A value for this can be obtained in
a manner similar to that for indicators of totals, described in Section 9.2.2.
MOE = margin of error = p * target value of the indicator. The first term, p, is the same as in the
formula for proportion. The second term, the target value of the indicator, is set by the IPs in
their IPTTs as the target value for the indicator to be achieved in the year in which the survey is
being conducted.
60
The same three adjustments as those described in Sections 9.2.3 for indicators of totals should be
applied here to the initial sample size to arrive at a final sample size.
A4.1.2 Data Analysis
Chapter 12 provides guidance on how to compute estimates of indicators of totals, and Chapter 13
provides guidance on how to compute associated confidence intervals and standard errors for estimates
of indicators of totals. The sections below provide similar guidance for indicators of proportions and
means.
Producing Estimates, Confidence Intervals, and Standard Errors for Indicators of
Proportions
Three of the Feed the Future MCHN and WASH annual monitoring indicators in Table A4.1 are
proportions. Producing estimates of indicators of proportions requires a formula that is different from
that used in Chapter 12 to produce estimates of indicators of totals. As before, survey implementers
should use a statistical software package, such as SAS, SPSS, or STATA, to generate the estimates.
However, the formula is given here to provide the reader a sense of the computations undertaken by
the statistical software packages. The formula for an estimate of a population proportion is:
= =
(
)/(
)
w
here:
w
final
i
= value of w
final
(the final sampling weight) for the ith sampled participant
= 1 if the ith sampled participant has the attribute in question (e.g.,
= 1 for the ith
sampled caregiver of a child under two participating in community-level MCHN interventions
who practices promoted infant and young child feeding behaviors, corresponding to indicator 8
in Table A4.1); 0 otherwise (i.e., if not practicing promoted infant and young child feeding
behaviors)
60
If the PaBS is being designed to establish base year values for the project, then using target values to be achieved after one
year of project implementation does not make sense. In this case, it is recommended to use an estimated value of the indicator
obtained through external sources instead.

Participant-Based Survey Sampling Guide for Feed the Future Annual Monitoring Indicators 117
= 1 if the ith sampled participant belongs to the sampling group corresponding to the
indicator (e.g.,
= 1 for the ith sampled caregiver of a children under two participating in
community-level MCHN interventions, corresponding to indicator 8 in Table A4.1); 0 otherwise
The formula to calculate a confidence interval with a confidence level of 95% for the estimate of a
proportion (denoted by
)
is the following:
= () ±
(1 )
where:
P = the sample-weighted estimate of the proportion, the formula for which is given above
z = the critical value from the Normal Probability Distribution (use of z = 1.96 is recommended)
= the design effect for the survey computed from the survey data
= the actual sample size realized after fieldwork
The formula to calculate the standard error associated with the estimate of a proportion, P, is the
following:
(
)
=
(
) =
(1 )
Producing Estimates, Confidence Intervals, and Standard Errors for Indicators of Means
None of the Feed the Future MCHN and WASH annual monitoring indicators in Table A4.1 are means.
However, IPs may choose to include custom indicators in their set of annual monitoring indicators for
MCHN and WASH that are means. Producing estimates of indicators of means requires a formula that is
different from that used to produce estimates of indicators of totals or proportions. As before, survey
implementers should use a statistical software package, such as SAS, SPSS, or STATA, to generate the
estimates. However, the formula is given here to provide the reader a sense of the computations
undertaken by the statistical software packages. The formula for an estimate of a population mean is:
=
=
(
)/(
)
w
here:
w
final
i
= value of w
final
(the final sampling weight) for the ith sampled participant
x
i
= the contribution to the numerator of the indicator from the ith sampled participant (e.g., the
number of food groups consumed by the ith sampled caregiver of a child under two
participating in community-level MCHN interventions, corresponding to the WDDS indicator in
Table A4.1)

Participant-Based Survey Sampling Guide for Feed the Future Annual Monitoring Indicators 118
= 1 if the ith sampled participant belongs to the sampling group corresponding to the
indicator (e.g., the ith sampled caregiver of a child under two participating in community-level
MCHN interventions, corresponding to the WDDS Indicator in Table A4.1); 0 otherwise
The formula to calculate a confidence interval with a confidence level of 95% for the estimate of a
proportion (denoted by
) is the following:
= (
) ±
where:
= the standard deviation computed from the survey data
The formula to calculate the standard error associated with the estimate of a mean,
, is the following:
(
)
=
(
) =

Participant-Based Survey Sampling Guide for Feed the Future Annual Monitoring Indicators 119
Annex 5. Computing Estimates of the “Percentage of
Female Participants of USG Nutrition-
Sensitive Agriculture Activities Consuming
a Diet of Minimum Diversity” Indicator
Table A4.1 in Annex 4 includes the Feed the Future annual monitoring indicator “Percentage of Female
Participants of USG Nutrition-Sensitive Agriculture Activities Consuming a Diet of Minimum Diversity.”
The computation of this indicator requires special methods in some cases. This is because a project’s
nutrition-sensitive agriculture activities can be embedded in agriculture interventions, community-level
MCHN interventions (such as the promotion of nutritious crop cultivation in the context of home
gardens), or both.
In the cases where nutrition-sensitive agriculture activities are embedded in one or the other type of
intervention, but not both, the indicator can be computed in the usual manner, and the overall estimate
from this indicator can be derived from a single PaBS (if that is the mode through which data for this
indicator are collected).
However, in the cases where nutrition-sensitive agriculture activities are embedded in both types of
interventions, there may be participants who engage in both sets of interventions, creating an overlap in
the set of participants across the two types of interventions. In such cases, data on this indicator can be
collected through two separate PaBSs: an agriculture-related PaBS in support of the agriculture
interventions and an MCHN-related PaBS in support of community-level MCHN interventions. However,
when data related to this indicator are collected through both types of PaBSs, special methods are
required to produce one overall estimate for the indicator by combining data from both sources; such
methods must take into account the potential double-contribution to the indicator estimate from the
overlap stemming from the participants who are engaged in both types of interventions. This annex
focuses on the case where participants are engaged in both sets of interventions, and describes a series
of steps necessary to derive a combined estimate using the data from the two separate PaBSs.
STEP 1. Identify the overlap between the agriculture intervention and the MCHN intervention using the
PaBS sampling frames. First, create the two sample frames of participants for each of the two surveys
(i.e., the agriculture-related PaBS and the MCHN-related PaBS). Because the indicator “Percentage of

Participant-Based Survey Sampling Guide for Feed the Future Annual Monitoring Indicators 120
Female Participants of USG Nutrition-Sensitive Agriculture Activities Consuming a Diet of Minimum
Diversity” relates only to females, drop any male participants from the two sampling frames.
61
62
Next, identify the overlap between the agriculture and MCHN interventions. This is done by matching
the two (reduced) sampling frames of female participants (through the unique identification numbers of
the participants). The matched units then define the overlap and the unmatched units define the two
non-overlaps.
STEP 2. Identify sampled participants in the overlap. For the agriculture-related PaBS, identify each
sampled participant from the survey who is a match with a participant on the overlap part of the
agriculture-related sample frame. Similarly, for the MCHN-related PaBS, identify each sampled
participant from the survey who is a match with a participant on the overlap part of the MCHN-related
sample frame.
63
Note that although there may be many sampled participants who are in common in the
overlap between the two samples, the sampled participants in the overlap may not coincide exactly
because different participants may have been randomly sampled for the two surveys. However, because
each subsample is representative of the entire overlap, estimates based on these subsamples must be
combined in such a way as to dampen the contribution of each to avoid double representation of the
overlap.
If there is no overlap between the agriculture and MCHN interventions, modifications need to be made
to the steps below; they are indicated where appropriate.
STEP 3. Generate separate and combined indicator estimates for the overlap. Next, compute two
separate estimates of the indicator using a subset of the data that is restricted to the overlap only (from
Step 2)—one estimate coming from the agriculture-related PaBS (denoted
-
), the other
coming from the MCHN-related PaBS (denoted
-
). The two estimates can be computed
using the formula given in Annex 4 for indicators of proportions, but restricting the data set to the
aforementioned subsample.
A combined estimate of the indicator for the overlap can be expressed as a weighted combination of the
two separate estimates of the overlap from the two surveys:
=
-
+ (1 )
-
where is a fixed constant between 0 and 1.
61
It is assumed that the two (agriculture-related and MCHN-related) PaBSs are conducted on participants of both sexes to
accommodate a variety of indicators where both sexes are implicated, and are not conducted solely to accommodate the
indicator “Percentage of Female Participants of USG Nutrition-Sensitive Agriculture Activities Consuming a Diet of Minimum
Diversity”. For this reason, the original frames include both females and males.
62
The removal of female participants is more relevant to the sampling frame for the agriculture-related PaBS than it is to the
sampling frame for the MCHN-related PaBS, because most participants involved in community-level MCHN interventions are
most often females, whereas participants involved in agriculture-related interventions can be either male or female.
63
Note that only sampled females from each of the two (agriculture-related and MCHN-related) PaBSs will be potential
matches since the frames on which matching are attempted have been restricted to include only females in Step 1.

Participant-Based Survey Sampling Guide for Feed the Future Annual Monitoring Indicators 121
An optimal choice for that maximizes the precision of the combined estimate of the indicator for the
overlap is given by:
=
-
-
+
-
where
-
and
-
are variance estimates of the separate indicator estimates
of the overlap,
-
and
-
, respectively. These variance estimates can be computed
using a statistical software package (such as SAS, SPSS, or STATA), and are automatically generated to
accompany the estimates of
-
and
-
by the statistical software package being
used.
64
Because < 1, the contribution to the combined estimate of the indicator for the overlap (
)
coming from each of the two separate estimates of the overlap (
-
and
-
) is
dampened to avoid double representation of the overlap.
Because the estimates from the two surveys are independent, the estimated variance estimator of the
combined estimate of the indicator for the overlap
is given by:
(
) =
-
+
(
1
)
(
-
)
This variance estimate is used in the next step.
STEP 4. Identify sampled participants in the non-overlap. Consider the sampled participants in the
non-overlap for the agriculture and MCHN interventions. For the agriculture-related PaBS, identify each
sampled participant from the survey who is a match with a participant on the non-overlap part of the
agriculture-related sample frame (i.e., sampled participants from the non-overlap). Similarly, for the
MCHN-related PaBS, identify each sampled participant from the survey who is a match with a
participant on the non-overlap part of the MCHN-related sample frame (i.e., sampled participants from
the non-overlap). In each case, these should constitute the complement of the sampled participants
identified in Step 2 for each survey.
65
If there is no overlap between the agriculture and MCHN interventions, the participants from the non-
overlap coincide with all of the sampled participants from each of the PaBSs.
STEP 5. Generate separate indicator estimates for each of the two surveys for the non-overlap. Next,
compute two separate estimates of the indicator using data that are restricted to the non-overlap
identified in Step 4—one estimate coming from the agriculture-related PaBS (denoted
--
),
the other coming from the MCHN-related PaBS (denoted
--
). The two estimates can be
computed according to the formula given in Annex 4 for indicators of proportions, restricting the data
set to the aforementioned subsample.
64
Most statistical software packages in fact generate standard errors of the estimates, rather than variances. The variances can
be computed as the square of the standard errors of the estimates.
65
As in Step 2, only sampled females from each of the two (agriculture-related and MCHN-related) PaBSs will be potential
matches since the frames on which matching are attempted have been restricted to include only females in Step 1.

Participant-Based Survey Sampling Guide for Feed the Future Annual Monitoring Indicators 122
STEP 6. Generate a combined overall indicator estimate using the contributions from both the
overlap and non-overlap. To create a combined overall indicator estimate (denoted
), we
combine
--
and
--
(the separate estimates of the indicator for the two
non-overlaps from the two surveys) with
(the combined estimate of the indicator for the
overlap) using a weighted combination given by:
=
--
+
--
+
(
1
)
An optimal choice for
that maximizes the precision of the combined overall indicator estimate is
given by:
=
--
--
+
--
+
and an optimal choice for
is given by:
=
--
--
+
--
+
Here,
(
--
) and
(
--
) are estimated variances of
--
and
--
, respectively. These variance estimates can be computed using a statistical software
package (such as SAS, SPSS, or STATA) and are automatically generated to accompany the estimates of
--
and
--
by the statistical software package being used.
STEP 7. Generate an associated variance estimate of the combined overall indicator estimate. Finally,
the variance of the combined overall indicator estimate,
, can be estimated as follows, exploiting
the fact that the overlap and the two non-overlap estimates are all independent of each other:
(
)
=
--
+
--
+
(
1
)
(
)
This variance of the combined overall indicator estimate should be reported as a measure of precision of
.
If there is no overlap between the agriculture and MCHN interventions, set
= 0 and set
= 0 in all of the above expressions.

